Basic Concepts
It is often useful to create a model using simulation. Usually, this takes the form of generating a series of random observations (often based on a specific statistical distribution) and then studying the resulting observations using techniques described throughout the rest of this website. This approach is commonly called Monte Carlo simulation.
Worksheet Functions
Excel Function: Excel provides the following functions for generating random numbers.
RAND() – generates a random number between 0 and 1; i.e. a random number x such that 0 ≤ x < 1.
RANDBETWEEN(a, b) – generates a random integer between a and b (inclusive)
Note that these functions are volatile, in the sense that every time there is a change to the worksheet their value is recalculated and a different random number is generated. If you don’t want this to happen, then enter RAND() on the formula bar and press the function key F9. This will replace the formula RAND() with the value generated. Alternatively, you can copy the random number (or a range of random numbers) using Ctrl-C and then paste them back into the same location using Home > Clipboard|Paste and then selecting the Paste Values option.
RANDBETWEEN only generates integer values. If you want a random number which could be any decimal number between a and b, then use the following formula instead:
= a + (b − a) * RAND()
Excel 365 Function: Excel 365 provides the following dynamic array function with spillover (see Dynamic Array Formulas).
RANDARRAY(nrows, ncols, a, b): fills an nrows × ncols range starting in the current cell with random numbers between a and b inclusive.
RANDARRAY(nrows, ncols, a, b, TRUE): fills an nrows × ncols range starting in the current cell with random integers between a and b inclusive.
If omitted nrows, ncols, and b default to 1, and a defaults to 0.
E.g. to generate 10 random numbers between 0 and 1 using Excel 365, you enter the formula =RANDARRAY(10) in cell A1 and press Enter.
If you are not using Excel 365, you can instead enter the formula =RAND() in cell A1, highlight range A1:A10, and press Ctrl-D.
More Worksheet Functions
Real Statistics Function: The Real Statistics Resource Pack provides the RANDOM function which generates a non-volatile random number.
RANDOM(a, b, FALSE, seed) = random number between a and b; i.e a non-volatile version of a + (b − a) * RAND()
RANDOM(a, b, TRUE, seed) = random integer between a and b, inclusive; i.e. a non-volatile version of RANDBETWEEN(a, b)
If a is omitted it defaults to 0, if b is omitted it defaults to 1 and if the third argument is omitted it defaults to FALSE.
If seed ≤ 0 or omitted then no seed is used, while if it is a positive value, then this value is used as a seed. You can use a seed to generate a repeatable sequence of pseudo-random values.
The Real Statistics Resource Pack also provides the following array function.
RANDX(nrows, seed, ncols): returns an nrows × ncols array of non-volatile random numbers between 0 and 1 where seed is as for RANDOM; the default for ncols is 1.
Data Analysis Tool
Excel Data Analysis Tool: In addition to the RAND and RANDBETWEEN functions, Excel provides the Random Number Generation data analysis tool which generates random numbers in the form of a table that adheres to one of several distributions. You can specify the following values with this tool:
Number of Variables = number of samples. This is the number of columns in the output table generated by Excel.
Number of Random Numbers = the size of each sample. This is the number of rows in the output table generated by Excel.
Distribution desired: specifies one of the following distributions:
- Uniform, specify α (lower bound) and β (upper bound)
- Normal, specify µ (mean) and σ (standard deviation)
- Bernoulli, specify p (probability of success); like the binomial distribution with n = 1
- Binomial, specify p (probability of success) and n (number of trials)
- Poisson, specify λ (mean)
- Patterned – specify a lower and upper bound, a step, repetition rate for values, and repetition rate for the sequence
- Discrete – specify a value and the associated probability range. The range must contain two columns: the left column contains values and the right column contains probabilities associated with the value in that row. The sum of the probabilities must be equal to 1.
Random Seed = an optional value used to generate the first random number. You can reuse this value later to ensure that the same random numbers are produced. If you leave this field blank, then a new random number will be generated each time.
Examples
Example 1: Simulate the Central Limit Theorem by generating 100 samples of size 50 from a population with a uniform distribution in the interval [50, 150]. Thus each data element in each sample is a randomly selected, equally likely value between 50 and 150.
Select Data > Analysis|Data Analysis and choose the Random Number Generation data analysis tool. Fill in the dialog box that appears as shown in Figure 1.
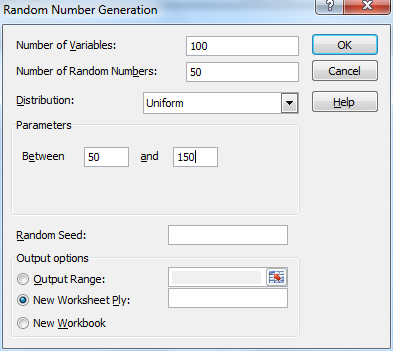
Figure 1 – Random Number Generator Dialog Box
The output is an Excel array with 50 rows and 100 columns. We next calculate the mean of each column using the AVERAGE function. The result is a row with 100 entries containing the means of each of the 100 samples. This is shown in Figure 2 (reformatted as a 10 × 10 array to fit on the screen better).
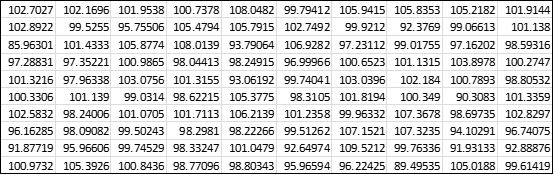
Figure 2 – Means of the 100 random samples
Histogram of the sample means
Using Excel’s Histogram data analysis tool we now create a histogram of the 100 sample means, as shown on the right side of Figure 3.

Figure 3 – Testing the Central Limit Theorem
Using the AVERAGE and STDEV.S functions, we calculate the mean and standard deviation of the 100 sample means from Figure 2. The mean of the sample means is 100.0566 (cell B7 of Figure 9.8.3) and the standard deviation is 4.318735 (cell B8). As you can see, the histogram is a somewhat imperfectly bell-shaped curve of a normal distribution.
Since the sample was taken from a uniform distribution in the range [50, 150], as can be seen from Uniform Distribution, the population mean is 

Based on the Central Limit Theorem, we expect that the mean of the sample means will be the population mean, which seems to be the case since 100.0566 is quite close to 100. We also expect that the standard deviation of the sample means to be
![]()
(cell B16) which is reasonably close to the observed value of 4.318735.
Random sample from a distribution
We can also manually generate a random sample that follows any of the distributions supported by Excel (or the Real Statistics Resource Pack) without using the data analysis tool. E.g. to generate a 25-element sample that follows a normal distribution with a mean of 60 and a standard deviation of 20, we simply use the formula =NORM.INV(RAND(),60,20) 25 times.
In column C (i.e. the column of x values) in Figure 4, we have done just that. E.g. cell C4 contains the formula
=NORM.INV(B4,$G$3,$G$4)
where cell B4 (and all the other cells in column B) contains the formula =RAND(). Column D contains the probability density values (i.e. labeled the y values) for each x value. E.g. cell D4 contains the formula
=NORM.DIST(C4,$G$3,$G$4,FALSE)
Finally, we create a scatter plot of the x values vs. the y values by highlighting the range C4:D28 and selecting Insert > Charts|Scatter as described in Excel Charts. The scatter plot shown in Figure 4 has the characteristic bell curve shape of the normal distribution.

Figure 4 – Creating a sample from a normal distribution
Drawing a random sample from a distribution
Similarly, we can generate random samples for any of the distributions supported by Excel (or the Real Statistics Resource Pack). E.g. to generate one element from the Poisson distribution with a mean equal to 7, we use the formula =POISSON_INV(RAND(),7) where POISSON_INV is the Real Statistics function described in Poisson Distribution.
We can also use the Real Statistics functions RANDOM or RANDX in place of RAND. This is especially useful if you desire a non-volatile random number or when you want to use a seed.
In Excel 365 environments, you can use RANDX as a dynamic array function. E.g. to obtain an estimate of the mean of the beta distribution with α = 4 and β = 6, you can perform a Monte Carlo simulation of size 10,000 via the worksheet formula =AVERAGE(BETA.INV(RANDX(10000),4,6)) to obtain a result such as 3.99901, which is close to the theoretical value of α/( α+β) = 4/(4+6) = .4. You can also use a seed such as in the formula = AVERAGE(BETA.INV(RANDX(10000,123),4,6)) to obtain .39985.
See Simulating a Distribution regarding the simulation of an unknown distribution.
Weighted random numbers
When using the Excel random number formula =RANDBETWEEN(1, 4), the probability that any one of the values 1, 2, 3, or 4 occurs is 25%. We now describe a way of varying the probability that any specific value occurs.
Real Statistics Function: The Real Statistics Resource Pack provides the following function.
WRAND(R1) = a random integer between 1 and n where R1 is an n × 1 column range of weights.
Example 2: Generate 20 random numbers from the set {1, 2, 3, 4} using the weights in range H4:H7 of Figure 5.
Thus, the probability of generating a 1 is 50/(50+10+20+20) = 50%, the probability of generating a 2 is 10/(50+10+20+20) = 10%, etc.
The result is shown in column J of Figure 5.
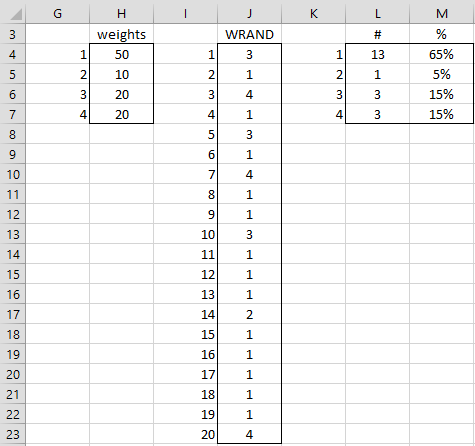
Figure 5 – Weighted random number generation
Here, each cell in range J4:J23 contains the formula =WRAND($H$4:$H$7). Range L3:M7 contains a tabulation of the number of times each of the values 1, 2, 3, and 4 occurs in the range J4:J23. E.g. cell L4 contains the formula =COUNTIF(J$4:J$23,K4). We observe that the frequency percentages in the range M4:M7 are similar (but not identical) to the probabilities that result from the weights.
Examples Workbook
Click here to download the Excel workbook with the examples described on this webpage.
Reference
Excel Easy (2021) Random numbers
https://www.excel-easy.com/examples/random-numbers.html
Hi Charles,
I’m doing a multi-stage simulation based on the RAND() function. It culminates in one cell which can either take the value 0 or 1.
Is there a way to calculate my cell’s likelihood of being 1, without manually running the simulation and recording the results?
Reuben,
If the random value is either 0 or 1, then the probability of being 1 is 0.5. If this is not your question, please explain further.
Charles
Hi Charles,
Your article is very informative and helpful for random real data generation.
I am trying to generate random data denoting power consumed by a household at different time intervals of a day (say for 24 hours with 1 hour interval size, from 12:00 AM to 12:00 AM). Curve plotted between time(X-axis) and power consumed(Y-axis) should look like this https://www.electrical4u.com/electrical/wp-content/uploads/2013/11/industrial-load-curve-2.gif
It can be seen in the figure that power consumed follows certain patter at different intervals of time. For example, from 12 AM to 6 AM its low, from 6 AM to 12 PM its slightly high, then from 6 PM to 12 PM it’s at the Peak.
How can we generate such data using random numbers in Excel?
Thanks,
Mohan
Mohan,
It seems to me that this depends on details of the pattern that are not known to me. Is there some underlying distribution?
Charles
Charles,
It’s not necessary to fit the random numbers to the exact pattern as shown in the figure. The rough idea drawn from the example curve is that the power consumption starts increasing at certain time (say 6 PM, as in the example curve), gets to peak in the span of some time interval (say it gets to peak at 8 PM) then again it starts falling and gets low at 12 PM. Now, how fast it increases with time or how fast it decreases with time is adjustable as per requirement. The point is “how to generate random numbers which starts increasing their magnitude at some time, get at peak at some later time and again start decreasing and get to some lower magnitude”.
Thanks,
Mohan
Mohan,
I don’t know how to solve this problem, except via trial and error.
Charles
Ok, no worries.
Thanks,
Hi
I want formula in Excel :
formula for generating random numbers by square method
Help me please…
Hi Sali,
I don’t have such a formula. The middle squares method is not really a good method for producing random numbers. In any case, see the following webpage:
http://users.jyu.fi/~tiihonen/simul/lectures/lecture4/Simulation_lecture4.pdf
Charles
I’m need to randomly change a certain percentage of values in an existing column of data, and the values created should be normall distributed at a certain starndard deviation. For example I have a column of termperatures, I want to introduce noise into this data randomly at a level of 5%, 10%, …., but he values can’t be obvious outliers. I’m trying to check the robustness of a forecast.
Kevin,
What percentage of the values can you change_ What do you mean by noise at 5%, 10%, etc._
Charles
hello sir
I have to generate Random number for P3 distribution with 10000 rep for different sample size to use my already estimated parameters of P3 distribution, please help me regards, same I will need for Kappa GEV etc distributions
thank you
Fayaz,
What is the P3 distribution? I know what the GEV distribution is, but what is the Kappa GEV distribution?
Charles
P3 is Pearson type 3 distributions its three parameters distribution, Kappa distribution is four parameters distribution, GEV, P3, and kappa are used in extreme value theory, like an Extreme values distributions.
I am waiting for your response, sir.
Fayaz,
Sorry, but this website doesn’t (yet) support these distributions.
Charles
Hi Charles,
Is it possible to generate a random set of numbers to simulate a completely randomized design?
I have 52 data points (representing mean crop yield), that I want to randomly assign 13 treatments with 4 replications. Thus each treatment will have 4 reps. RANDBETWEEN(1,13) does not generate an equal amount of replicates per treatment. Is it possible to do this in excel?
Thanks
Devin
Devin,
If you can generate a random permutation of the 52 elements, you can use the first 4 for treatment 1, the next 4 for treatment 2, etc.
The Real Statistics SHUFFLE function can be used to create the random permutation. You can also access this capability from the Reformatting a Data Range data analysis tool.
You can also use standard Excel capabilities to create a random permutation, as described at
https://real-statistics.com/sampling-distributions/sampling/
Charles
Thanx that’s really helpful..
I want to generate gamma distribution. Is it possible in excel. Should I calculate mean and std.dev. of gamma distribution and then generat normal distribution? Will it work?
Omer,
If you want to generate a gamma distribution, then the approach that you are suggesting doesn’t seem to be appropriate.
If you want a gamma distribution with particular alpha and beta values, then randomly generate values for this gamma distribution using the formula =GAMMA.DIST(RAND(),alpha,beta, FALSE). You can then graph the function as described in Figure 4 for the normal distribution.
If you don’t know the alpha and beta values, then you can estimate these using the approach in one of the following webpages:
Method of Moments
Fitting a Gamma Distribution via MLE
Charles
Conduct a MONTE CARLO SIMULATION including bounds of a 95% confidence interval, probability that the return would be zero, show at what return there will only be a 20% chance of being larger, and create the cumulative distribution graph showing actual relative to theoretical, and comment on the degree of normalcy of the data.
min max
growth rate sales/month uniform 0.001 0.004166667
starting cm triangular $120.00 $160.00 $190.00
mean sd
growth rate cm/month uniform min max
0.0008 0.003
discount rate/month normal 0.01 0.001
min mode max
time zero cost triangular $1,500,000.00 $1,800,000.00 $2,500,000.00
mean sd
current sales of units per month normal 10000 100
time to evaluate cash flows months 60
I cant understand this please help
Fari,
Perhaps it is easier to explore which parts of this you do understand.
1. Do you know what a uniform distribution is?
2. Do you know what a normal distribution?
3. Do you know how to test whether data is normally distributed?
4. Do you know how to conduct a Monte Carlo simulation?
5. Do you know how to conduct a Monte Carlo simulation where the data is normally distributed?
Charles
hi
out of 25 marks student got 20 marks
20 mark must distributed 5 columns which equivalent of 25 marks in random marks which is not more than 5 in column =average must 20 only no digits values required
wt is formula for this in excel plz
Sorry Rajagiri, but I don’t understand your question.
Charles
Hi Charles…may I know how to create binomial distribution for more than 100 inputs.. the sample is shown below for 4 inputs which I done manually;
T C1 C2 H
0 0 0 0
1 0 0 0
0 1 0 0
1 1 0 0
0 0 1 0
1 0 1 0
0 1 1 0
1 1 1 0
0 0 0 1
1 0 0 1
0 1 0 1
1 1 0 1
0 0 1 1
1 0 1 1
0 1 1 1
1 1 1 1
appreciate if u can guide me on how to simulate automatically this 0 & 1 combinations using excel as I need to do it for 100 samples…do I need to specify any conditions for each success rate; for an example 1 sample success followed by next quantity success? please help me..
Thiva,
The approach for more than 100 samples is the same as for one sample. To create one sample element for a binomial distribution B(n,p), you use the formula =BINOM.INV(n,p,RAND()). If you need a sample of size 1,000 you simply repeat this formula 1,000 times.
Charles
Hi Charles,
May I ask if you know how to generate randon data for a M/M/1 queue with λ=4 and µ=5?
My question here is to find the expected time in the system.
Your help is much appreciated:)
Aaron,
Generally you would use an exponential distribution to model inter-arrival and service times.
To generate a random number that adheres to say the t distribution with df degrees of freedom, you would use the formula =T.INV.2T(RAND(),df).
You do the same for the exponential distribution. The only problem is that Excel doesn’t provide an inverse to the exponential distribution. As explained on the webpage Exponential Distribution you can use the fact that the exponential distribution is equivalent to the gamma distribution with α = 1 and β = 1/ λ. Thus, EXPON.DIST(x, λ, cum) = GAMMA.DIST(x, 1, 1/λ, cum).
Since there is no EXPON.INV(p, λ) function in Excel, you can use GAMMA.INV(p, 1, 1/λ) instead. Thus, to generate a random value that follows the exponential distribution you can use the Excel formula =GAMMA.INV(RAND(),1,1/λ).
Charles
Appreciate your guidance on how to generate a normally distributed random set of data that follows a specific trend-line equation between min and max values.
Hi Charles
I just want to know why the mean and standard deviation of the generated set of random numbers differs from that specified when generating the random numbers using the random number generator.
Regards
Johnson
Johnson,
The Central Limit Theorem describes the relationship between the mean and standard deviation of sample and the population. The means are expected to be about equal, but there is always sample error, which will mean that the means won’t be exactly the same. The larger the sample the more similar the result. The standard deviation will differ by approximately a factor of the square root of the sample size.
Charles
Hi Charles
Thanks alot much appreciated
Hi Charles,
Would like to generate coded data with 3 variables x1 , x2 and x3 coded as -1 , -0.58 , -0.5 , 0 , 0.5 , 0.58 , 1. This should have all the possible combinations bringing the sample sizes to 26 and a response. Is this possible?
Emmy,
Sorry, but I don’t understand your question.
Charles
Dear Charles,
Thank you for posting such an informative blog. I struggle with the concept of assigning probability distributions to random variables I would like to simulate given its “philosophical” nature as Wikipedia puts it. “The meaning of the probabilities assigned to the potential values of a random variable is not part of probability theory itself but is instead related to philosophical arguments over the interpretation of probability.”
I’m looking to apply this concept in Finance when projecting company financials but could not find a procedure for it.
To give an example, Cost of goods sold for a company is a variable cost by its nature and there is a space (range of likely values) I can determine (as a function of Sales) however some values are more likely to happen than others. So instead of constructing the random number generator using a skewed normal distribution, or lognormal distribution, is there a procedure I can follow to standardize associating probability distributions and ANY random variable? I’m using excel as well just as an FYI.
Any input is appreciated!
Onur Can
Onur,
Given a data set, are you looking to find the distribution that best fits the data?
Charles
How can I generate and show a time series data for a single variable
for time index 0 to ????1: Independent normally distributed data with mean ????̅1 and
standard deviation ????1.
Rich,
See Time Series Analysis
Charles
Hello
Is it possible using Excel to generate values for two or more normally distributed variables that are correlated, and to specify the co-variance between them?
Rob
Rob,
See the following webpage
Multivariate Normal Random Numbers
Charles
Hello,
I have determined that the given data set follows Generalized Extreme Value Distribution (after calculating probability density (PDF) for each value and comparing with the histogram).
My question is, how to generate a random number in excel, between two points, which will be based on previously determined PDF (in this case Generalized Extreme Value Distribution)?
I would like to use that function for creating VBA code.
Thank you in advance.
Igor,
In general, if you know the inverse cumulative probability distribution (not pdf, but cdf), then you should be able to generate random numbers for this ditribution. If e.g. the inverse function in Excel is XYZ.INV(p, parameters), then the formula for generating random values id XYZ.INV(RAND(), parameters). For the t distribution this T.INV(RAND(),df).
Charles
Hello,
I would like to generate a normal distribution using the mean, std, upper specificaiton limit and lower specification limit. How can i do this?
Flavia,
It is sufficient to have the mean and standard deviation. The lower/upper confidence intervals need to be compatible with these values (otherwise the problem is over-constrained and there is no corresponding normal distribution.
If you have mean m and standard deviation, you can generate random values for this normal distribution using the formula =NORM.INV(RAND(),m,s).
Charles
How can I generate random numbers in excel to simulate the downside deviation given by the Sortino ratio (at a given MAR, Minimum Acceptable Return)?
I want to simulate stock market returns using a strategy that has a given standard deviation and a given downward deviation (I.e., when the portfolio is below a minimum acceptable return , such as 5%). So, for example:
The strategy produces a compounded annual gain of 9%.
The standard deviation is 15%.
The downside deviation is 10%. The “downside” is any result below 5% (including below zero). How can I simulate this distribution in excel? Thank you
Sorry but I am not familiar with the Sortino ratio and have not yet supported this in the software or on the website.
Charles
i want to generate bivariate random samples (x,y) in excel how it will be done
Nazim,
Please explain what you mean by a bivariate random sample.
Charles
sir i want to generate pairs of random samples from bivariate normal distribution with values of u1,u2,sigma1,sigma2 and roh are given
Nazim,
If say you have a distribution function DIST(x, param1, param2, …) in Excel whose inverse function is INV(p, param1, param2, …), then the way to generate random samples from this distribution is to use the formula INV(RAND(), param1, param2, …).
Thus what you need for your problem is an Excel function for the inverse of the bivariate normal distribution. Excel does not provide this function nor does the Real Statistics Resource Pack currently. You would need to write such a function yourself, although I plan to add this to the Real Statistics software at some point in the future.
Charles
actually i want to solve this question
Suppose X1,X2…Xn & Y1….Yn be two random samples from bivariate norm. Dist. With u1=10 & u2=13. Sigma1=sigm2= 4 & r=0.8.draw ten pairs random samples from this distribution (X1,Y1)….(X10,Y10) & compute r using 1000 replications assess the empirical dist. of ‘r’
Charles,
I need to generate random numbers based on a normal distribution but the mean of that distribution needs to be able to change for each cell, any way to do that?
Jacob,
Use =NORM.INV(RAND(),m,s) where m and s are the mean and standard deviation that you want.
Charles
Thank you!
I need to also do a negative exponential distribution where the mean is constant but the numbers need to update when I press F9?
Jacob,
You can simulate a negative exponential distribution in the same way as you do a normal distribution. The only problem is there is no EXPON.INV(p, λ) function in Excel, but instead you can use GAMMA.INV(p, 1, 1/λ). Thus, the formula you need for the simulation is GAMMA.INV(RAND(), 1, 1/λ).
Charles
Hi,
I need to generate non-negative random variables from Normal distribution in exxcel. how can i do that? little help plz…..
Hi,
I am not sure what you mean by generating random variables. Do you want to generate data that adheres to a normal distribution and is non/negative. If so, what mean and standard deviation do you have in mind?
Charles
Respected Sir! Charles
How can I generate random numbers following binomial distribution?
Thanks
Maria,
As described on the referenced webpage, you can either use Excel’s Random Number Generator data analysis tool or the formula =BINOM.INV(n, p, RAND()) where n and p are the sample size and probability of success on any trial.
Charles
Thanks a lot.
Hello Charles,
I have two questions as followed:
1. I would like to random pick a text with different probability to each
such as:
Text Probability
A 10%
B 20%
C 30%
D 40%
However, I have tried LOOKUP like below (different set of data though)
=LOOKUP(RAND(),$B$5:$B$14,$A$5:$A$14)
but it doesn’t seem to take into account the probability
Do you have any suggestions?
2. Later on, if I have to pay 10$ per random, I wonder how much I have to pay to get ‘A’
Thanks 🙂
Sorry, but neither question is clear to me. For question 1, you seem to be referring to a two-dimensional table from which you pick entries at random. You need to describe the situation in more detail: things like how many rows and columns there are in the table and what sort of row or column headings there are (if any) and whether the only text in the table are A, B, C and D, etc.
Charles
Sorry for the unclear explanation.
Column A: from row 1-4 are A, B, C, D
Column B: from row 1-4 are probability to appear of the above characters in oder: 10%, 20%, 30%, 40%
At one other cell, I would like to random any letter from those 4 regarding their different probability. Which formula should I put in?
However, I have tried LOOKUP like below (different set of data though)
=LOOKUP(RAND(),$B$1:$B$4,$A$1:$A$4)
but it doesn’t seem to take into account the probability.
Thank you : )
Qianqiu,
I believe that you are looking to pick a letter A, B, C or D based on their corresponding probabilities. In the next release of the Real Statistics software I will add a new function called WRANK which will do this (I need this function for something else I am adding). In the meantime, you can do something similar in Excel as follows.
Suppose that range A1:B4 have the values that you have written. We put the cumulative probabilities in column C using the formula =B1 in cell C1 and the formula =C1+B2 in cell C2. We then highlight the range C2:C4 and press Ctrl-D. To select one letter based on the stated probabilities, we place the following formula in cell E1:
=INDEX(A1:A4,IFERROR(1+MATCH(RAND(),C1:C4,1),1))
Charles
hello could i generate the discrete data in normal distribution shape
Use the following formula as many times as you like:
=NORMSINV(RAND())
This generates discrete data from a standard normal distribution. You can also use the formula:
=NORMINV(RAND(),m,s)
where m is the mean and s is the standard deviation.
Charles
Hi Charles. I want to simulate a log-normal distribution on excel with a mean of X and an SD of Y. The median should be larger than X. The real data would be expected to be “near-normal” but the lower limit is 0. Carrying out a simulation using =exp(norminv(rand(),ln(M),ln(S)) doesn’t get the desired effect – if S is relatively large, I get many large #s for the cells that are not realistic, if I lower Y the minimum value generated drifts too far away from 0. Am I doing something wrong? Thanks.
Scott,
Do you get the same result if you use =LOGNORM.INV(RAND(),M,S)?
Charles
Hi Charles,
I wonder if you could help please. I need to perform a randomisation by preference and wonder if excel will do this for me. I have 24 students who will be allocated a research project and will provide me with their top 4 preferences (1-4, of a possible 21 projects). I want to give as many as possible their first preference and then second etc. Does excel do this for me?
Many thanks
Helen,
There must be some other constraint(s) that you haven’t mentioned, otherwise you could simply give every student their first choice. The constraint can’t be that each of the 21 projects must be assigned to one student only since you have more students than projects. Please clarify.
Charles
Hi Charles,
I wanted to say this in another commen to avoid confusion.
If i have a dataset of 4 numbers, say, 6,9,9,12. It is assumed that they follow a Poisson distribution.
How can 90% prediction interval can be found out with mean of the distribution being Equal to 9(average of 6,9,9,and 12).
Prediction interval of 5th number is required. (I know the answer [5,14] but i dont know the procedure to perform it through software)
Thanks!
Hi Shivam,
I have just updated the Poisson Distribution webpage with additional information, including how to calculate the confidence interval. See the webpage
Poisson Distribution
Here are two other webpages that you may also find useful:
http://ms.mcmaster.ca/peter/s743/poissonalpha.html
http://www.ine.pt/revstat/pdf/rs120203.pdf
Charles
Hi Charles,
I want to generate 1000 data sets. Each set must have 10 numbers which:
—-are Poisson Distributed and mean of the Poisson distribution is 185
—-have a constant sum of 180 (10 digits of the set must add up to 180)
Please suggest which functions or Tools can i use for this.
Thanks and Regards
Hi Shivam,
To generate numbers which follow a Poisson distribution with mean 185, use the formula =POISSON.INV(RAND(),180) where POISSON_INV is a Real Statistics function.
I don’t understand what you mean by “10 digits of the set must add up to 180”. When you say “digits” do you simply mean “values”?
Charles
Sorry for using the wrong term. Yes, i meant values. The 10 values must be found; condition being they add up to 1800.
Hello Charles,
Can you show one link for MCMC(Markov-Chain Monte-Carlo) method based on Excel ?
Thanks.
Sorry, but I don’t have a tutorial on MCMC on the website,
Charles
I have a question about How I can do in excel Normal Distribution values ” to generate bell Curve ” for a cash flow.
Let say that I have 3 Million USD, want to be normally distributed over 17 months
What Function I have to write
To generate random values from a normal distribution with mean m and standard deviation s, use the formula =NORM.INV(RAND(),m,s) for each random value you want to generate.
To create the bell curve for a normal distribution, use the approach of Example 1 on the webpage https://real-statistics.com/normal-distribution/basic-characteristics-normal-distribution/
Charles
Hey charles i have a question on how i would simulate something on excel.
I am given the Daily Demand (5,10,15,20,25,30) and have the probability of each daily demand (5=8%, 10=12%, 15=25%, 20=20%,25=20%,30=15%).
How would i input these variables into excel to get a random simulation 25 times?
Thanks, Sebastian
Sebastian,
There are many ways of doing this, but here is a simple approach.
Insert your input values in columns A and B (starting at cell A1), as shown below. Put the cumulative probability values in column C (e.g. cell C3 contains the formula =C2+B3). Now generate 20 random values between 0 and 1 by placing the formula =RAND() in cells D2 through D21 (I only show the first 8 of these values below. Finally place the following formula in cell E2 and then highlight the range E2:E21 and press Ctrl-D.
=IF(E2>C$6,A$7,IF(E2>C$5,A$6,IF(E2>C$4,A$5,IF(E2>C$3,A$4,IF(E2>C$2,A$3,A$2)))))
x prob cum rand x
5 0.08 0.08 0.223795251 15
10 0.12 0.2 0.864387315 30
15 0.25 0.45 0.207723247 15
20 0.2 0.65 0.065415441 5
25 0.2 0.85 0.872165177 30
30 0.15 1 0.127854805 10
1 0.32286142 15
0.879552291 30
Charles
Thanks Charles. I explained my problem poorly. I am interested in a population that passes or fails a test over a range of doses. 50% pass at 100, and the distribution is normal with sd= (say) 10. I know the average pass rate at a dose of 88, but would like to visualize the spread of results with limited sample sizes at given doses. So if I tested 30 sets of 10 samples at 88, the average pass rate for all 300 would be 11.5%, but the actual results per sample may vary from say 3% to 18% pass rate. I suspect the distribution would be normal but would like to model it with excel,mostly for illustration purposes.
Mick,
Since the population has a normal distribution with mean 100 and std deviation of 10, yes indeed the average pass rate for a dose of 88 is NORM.DIST(88,100,10) = 11.5%. If you generate a sample of size 10 for a dose of 88, the actual pass rate for each sample will take a value of
If you want to generate a sample of size 10 with a dose of 88, you simply generate 10 random numbers using the formula =RAND(). You then count how many of the random numbers are less than NORM.DIST(88,100,10) and divide by 10. This is the pass rate for that sample, and will take a value of 0%, 10%, 20%, …, 100% (with the higher amounts unlikely to occur). If you create 30 such samples, then you can create a histogram with the results
This may not serve the purpose that you have in mind, but that is what would happen. Most likely you want to perform some sort of benchmarking or resampling. You can learn more about this on the webpage Resampling Procedures.
Charles
Thanks Charles.
I want to illustrate random results of testing say 10 samples at a dose of 88 from a normal population whose mean is 100 and SD is 10. I know that the cumulative mean response of many sets of 10 will be 11.5%, but how to generate the data please.
Hi Mike,
I don’t understand your question, since if all 10 doses are 88, then the data consists of 10 doses of 88.
In any case, if you want to generate 10 data elements at random from a normal population with mean 100 and SD of 10, then use the following formula 10 times: =NORM.INV(RAND(),100,10).
Charles
Hi
how will u explain statistical simulation to a layman
Sanjay,
This is not always an easy thing to explain simply, but here goes my attempt:
Often data comes from the real world — stock market prices, number of cases of Ebola, blood pressure, etc. Sometimes it is necessary to create data from scratch based on some criteria. This can be done by generating numbers at random which meet the desired criteria. This is called simulation.
You might generate such simulated data for testing or to better understand some phenomenon for which real-world data is not available. Sometimes you use simulation for testing when no analytical tools (i.e. formulas) exist.
The referenced webpage tries to explain how simulation is performed using Excel.
Charles
Respected Sir, i want to know random variable that follow t-distribution is generated in MS Excel.
Use the formula =T.INV(RAND(),df), where df is any constant >= 1 that you want to use.
Charles
Hi,
1. How i can generate a set of data up to 1000 in non normal distribution and unequal variances. I using T-test
2.
Janet,
You need to specify which non-normal distribution and what unequal variances you want to see.
Charles
Hi Charles,
To generate the non-normal data, I use ” =CHIINV(Rand(),df)”
But i would like to generate two set of data with unequal variance. How can i set the variance in the formula?
Or other formula can be use? As long as it generate non-normal data.
Janet,
Since the variance of the chi-square distribution with df degrees of freedom is 2*df, simply choose two different values for df. E.g. =CHIINV(Rand(),df) and =CHIINV(Rand(),df+1) for any value of df.
Charles
Charles,
I was set the variance to be 1 and 36, but the degree of freedoms cant be 1/2, what can i do?
Hi Charles,
I’m trying to use excel data analysis tool to get random numbers with normal distribution…but right now the given mean is 1≤µ≤10..so I’m confused how should i insert the mean..as the mean is not a single number..please help me..thank you
If you knew the mean m and standard deviation s, you would use the formula =NORM.INV(RAND(),m,s). If the mean takes a random value between 1 and 10, you could use the formula =NORM.INV(RAND(),1+9*RAND(),s), where s = the standard deviation.
Charles
Hi charles,
I am trying to use Box Muller equation to transform from uniform distribution to normal distribution. I have calculated the normal distribution variables but i don’t seem to know what against what to plot to see if actually the distribution is normally distributed.
The Real Statistics website provides quite a few ways to determine whether data is normally distributed. Please see
Testing whether data is normally distributed.
I suggest using the QQ plot and Shapiro-Wilk test
Charles
Thanks for the excellent work!
I just have a quick question.
Can we still use simulation techniques if we don’t know about the statistical distribution of the population under study? If yes, how?
There are many techniques for using simulation without having a specific distribution. On the website, I describe resampling techniques — see the webpage Resampling Procedures.
Charles
Hello Charles.
i need your help in generating random numbers or simulation through excel but i’m using inverse Cdf function and my function is as follows;
F(x)^-1=((2*arctan(x/a))/Pi)
I’ve to generate 10,000 random numbers of different sizes like 10, 20, 30 etc through upper defined function where we have different values of a like 0.1, 0.2, 0.3 etc.
could you please help me n guide me.
regards,
Aiman Ali
Hello Aiman,
Since the formula is an inverse cdf, the variable x can only take values between 0 and 1, and so the way to generate 10,000 random values for this distribution would be to insert the following formula in 10,000 cells of the Excel worksheet (assuming a is a constant):
=((2*arctan(RAND()/a))/Pi)
I don’t understand what you mean by “numbers of different sizes like 10, 20, 30 etc through upper defined function where we have different values of a like 0.1, 0.2, 0.3 etc.”, and so I am not able to advise you about this part of your question.
Charles
Hi!
Thank u so much Charles i’m very grateful of you. well I’ve to do simulations, making a table of means n variances values on different sample sizes which are 10, 20, etc and the upper defined values in points are of “a”. which is actually a parameter of my distribution which I’ve estimated. i hope now you got my point. and again thank u so much for your help and time. now I’ve made a software in R language. so now i’m doing simulation through R, and trust me it’s a lot easier. but your reply is really mean a lot to me. 🙂 🙂
regards
Aiman Ali
Aiman Ali hi
same problem I faced please send me that R command I have to generate 10000 rep for different sizes of P3 distributions I will be very thankful
can u help me with codes for montecarlo simulation on refractivity data for 10 years and how to detrend for 10 years data
You would need to provide more information for me to be able to help you with such an activity.
Charles
Hi.
Nice post.
Need to generate random number with given probabilities.
Prob No
0.1 -1
0.65 0
0.25 5.
Could you help me with the process.
One approach is as follows:
Insert the formula =RAND() in the cell A1
Insert the formula =IF(A1<.1,-1,IF(A1<.75,0,5)) in cell A2 Cell A2 now contains the result I believe that you are looking for. Charles
Thank you Charles 🙂
Hello
Our professor asked for a VB formula to fix the random numbers in excel and He emphasized that there should be a formula for that not just fixing it as a number in each cell with “Paste Values” or etc…
I would very appreciate if you could help me with that.
Just call the RAND function within a VBA subroutine and output that value to some cell in a spreadsheet.
If you need to use a function instead of a subroutine, then the output will be fixed unless you change the cell containing the function.
Charles
I have used the function (=poisson_inv(rand(),lemda), however i could not find any result. I also used other functions like exponential, etc. but no result.
I just used the formula =POISSON_INV(RAND(),4) and got the result 5 (which changes to 9 if I change any cell in the worksheet since RAND() is a volatile function).
Charles
Hello
I have to simulate a Process with Random Number’s, the plot control charts for the Attributes
1) I need to Simulate Random Numbers using poisson & discrete.
2) To plot control charts for Attributes i.e. from the generated random number’s
Can you Please explain it
Thanks & Regards
Shyam
Shyam,
To generate a random number which follows a Poisson distribution with mean lambda, you can use the Real Statistics formula =POISSON_INV(RAND(),lambda)
Charles
The formula =POISSON_INV(RAND(),lambda) reported a name error in my excel sheet. What could have been the error.
Chidochashe,
A formula such as =POISSON_INV(RAND(),6) should work provided you are using one of the latest version of the software.
What do you see when you enter the formula =VER() and are you using Windows or Mac?
Charles
Hello,
I have to generate an exponential distribution between 0.25 and 6, total 9 data points allowed, and their total should be 25. How do I go about doing this?
Thanks in advance.
Regards.
Sorry, but I don’t completely understand your question, but in any case I hope the following is helpful.
To generate one random data element which follows an exponential distribution with lambda parameter λ, use the formula =EXPON.INV(RAND(),λ). If you want 9 data elements, just repeat the formula 9 times. The only problem with this is that Excel doesn’t provide the EXPON.INV inverse formula. Fortunately, the exponential distribution is a special case of the gamma distribution and so you can use =GAMMA.INV(RAND(), 1, 1/λ) instead.
Charles
pLz :
how i can perform this request in details :
Generate 100 random numbers follow the following distributin:
1. Uniform with a=10 and b=100,
2. Normal with mean 70 and standard deviatin 4.5
3. Negatie distributin with mean 1.25
1. I have just updated the reference webpage to provide more details as to how to generate 100 random numbers which follow the uniform distribution with a = 50 and b = 150 (question 1 with different values for a and b).
2. The approach for the normal distribution is similar. Alternatively you can use the following approach. Place the formula =NORM.INV(RAND(),70,4.5) in any cell and then copy it 100 times (e.g. by using Ctrl-D).
3. I don’t understand which distribution you are referring to.
Charles
If in question 3 you mean the negative binomial distribution, then you won’t be able to use Excel’s Random Numbers Generation data analysis tool since this tool doesn’t support this distribution. Instead place the following formula in any cell:
=NEGBINOM.INV(RAND(),60,20) 25 times.
Hi Charles.
I do quite a bit of Monte Carlo work and it is useful to simulate distributions as you go, rather than get a fixed list from the Tool Pack. You probably know the first two but you might be interested in the Poisson which I have never seen published. The normal is obvious, the binomial less so, and the Poisson is a very good approximation.
=NORMINV(RAND(),20,5) random normal mean = 20 sd = 5
=CRITBINOM(20,0.9,RAND()) random binomial n= 20 p = 0.9
=CRITBINOM(10000,5/10000,RAND()) random Poisson lambda = 5
Cheers Derek
Derek,
Thanks for sharing this. In the next release of the Real Statistics Resource Pack I am adding a new function POISSON_INV. In this case you could also use =POISSON.INV(RAND(),5).
Charles