Introduction
As described in Confidence Intervals, a confidence interval provides a way of estimating a population parameter by a corresponding sample statistic to a given level of confidence. We show how to estimate the population mean (the parameter) by the sample mean (the statistic). In particular, if the experiment is repeated a sufficiently large number of times, then the true population parameter will lie in the 1–α confidence interval in 100(1–α) percent of the samples.
Basic Concepts
The tolerance interval, on the other hand, is an interval pertaining to the entire population and not just to a specific parameter. In particular, we expect that 100(1–α) percent of the entire population will lie in the 1–α tolerance interval.
We now show how to calculate a tolerance interval based on sample data taken from a normally distributed population. In particular, we want to find an interval of the form
![]()
that contains p% of the population with 100(1–α)% confidence, where x̄ is the sample mean and s is the sample standard deviation
![]()
See Non-parametric Tolerance Interval for sample data that is not normally distributed.
Howe Estimate
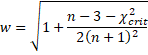
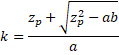
We provide the following estimate for k (due to Howe):

where n is the sample size, χ2crit is the critical value of the chi-square distribution at α with df = n–1 degrees of freedom and zcrit is the critical value of the standard normal distribution at the value where the cdf is (p+1)/2. Thus
![]()
![]()
Guenther recommends using wk instead of k, especially for smaller samples, where
There are also one-sided tolerance intervals. In particular, we want to find the value of k such p% of the population falls in the interval (x̄–ks, ∞) with 100(1–α)% confidence. The same value of k will ensure that p% of the population falls in the interval (-∞, x̄+ks) with 100(1–α)% confidence.
Natrella Estimate
We provide the following estimate for k (due to Natrella)
where![]()
and
zp = NORM.S.INV(p) zα = NORM.S.INV(α)
There is also an alternative estimate based on the noncentral t distribution, namely
![]()
where tcrit is the critical value at α of the noncentral t distribution T(n–1, zp√n). This can be calculated via the Real Statistics formula
tcrit = NT_INV(α, n–1, NORM.S.INV(p)*SQRT(n))
You can also estimate the sample size required to obtain a particular tolerance interval by using Excel’s Goal Seek capability.
Worksheet Function
Real Statistics Function: The Real Statistics Resource Pack contains the following function:
TOLERANCE_NORM(n, p, α, type) = k value of the tolerance interval for a normal distribution (actually k′ for the two-sided interval)
n = sample size, p = tolerance (default .9), α = significance level (default .05)
type = 2 (default) for a two-sided interval, type = 1 for a one-side interval using a non-central t distribution, and type = 0 for a one-sided interval using the Natrella approach.
Other Resources
Click here for an example of how to calculate the two-sided and one-sided tolerance interval for normally distributed data
Click here for tolerance intervals for sample data that is not normally distributed.
For information on how to construct tolerance intervals for both normally and non-normally distributed data in Excel using Real Statistics functions, click here.
Finally, click here for information about obtaining a crude estimate of the sample size requirements for tolerance intervals.
References
NCSS (2019) Tolerance intervals for normal data
https://www.ncss.com/wp-content/themes/ncss/pdf/Procedures/PASS/Tolerance_Intervals_for_Normal_Data.pdf
NCSS (2019) Tolerance intervals for any data (nonparametric)
https://www.ncss.com/wp-content/themes/ncss/pdf/Procedures/PASS/Tolerance_Intervals_for_Any_Data-Nonparametric.pdf
NIST (2019) Tolerance intervals for a normal distribution
https://www.itl.nist.gov/div898/handbook/prc/section2/prc263.htm#cases
Young, D. S. (2010) tolerance: An R package for estimating tolerance intervals
https://www.jstatsoft.org/v36/i05/
Hello Charles,
I am looking for a clear formula for TIs which are to be used in non-linear regression (4- parameter logistic function in particular, for one dependent and one independent varible). Unfortunately I’m failed to find a proper literature on this specific topic (to my knowledge, formula in the literature are versatile and complicated without using an automatic calculation via a software). Can you please share your recommendations for me to understand the way of calculation of TIs for such a case or advice some useful references?
Hello Eda,
Sorry, but I am not familiar with this topic. Perhaps someone else looking at the site can help.
Charles