We now describe various approaches for generating a random sample in Excel.
Excel Data Analysis Tool
Excel provides a Sampling data analysis tool that can be used to create samples. The tool works by defining the population as a range in an Excel worksheet and then using the following input parameters to determine how to carry out the sampling.
Input Range – Specify the range of data that contains the population values you want to sample.
Sampling Method – Select one of the following two sampling intervals:
- Periodic – In this case, you need to specify the Period n at which you want sampling to take place. The nth value in the input range and every nth value thereafter is copied to the output column. Sampling stops when the end of the input range is reached.
- Random – In this case, you need to specify the Random Number of Samples. This number of values is drawn from random positions in the input range. A value can be selected more than once. (i.e. sampling is with replacement).
The output is a column range that contains a sample drawn from the data in the Input Range as described in the Sampling Method.
Example
Example 1: From a population of 10 women and 10 men as shown in the range A5:B15 of Figure 1, create a random sample of 6 people for Group 1 and a periodic sample consisting of every 3rd woman for Group 2.

Figure 1 – Creating random and periodic samples
You need to run the sampling data analysis tool twice, once to create Group 1 and again to create Group 2. For Group 1 you select all 20 population cells as the Input Range and Random as the Sampling Method with 6 as the Random Number of Samples. This is done by selecting Data > Analysis|Data Analysis, choosing the Sampling data analysis tool, and then filling in the dialog box that appears as shown in Figure 2.
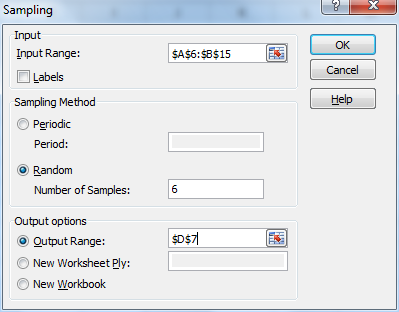
Figure 2 – Dialog box for the Sampling data analysis tool
The output is shown in the range D7:D12 of Figure 1.
For Group 2 choose B6:B15 as the Input Range and 3 as the Periodic Period for the Sampling Method. The output is shown in range E7:E9 of Figure 1.
Limitations of the data analysis tool
The Sampling data analysis tool has several limitations which unfortunately reduces its usefulness. These include:
- Only numeric data and blanks (e.g. empty cells) can be used.
- If in the example above the number of women is not equal to the number of men any blank cells will simply be treated as data and can be chosen for inclusion in a sample.
- The Label option does not function properly and so should not be used
- Random sampling is with replacement. As you can see from the example, the number 2 is chosen twice in the Group 1 sample. Sampling without replacement is not supported.
Sampling w/o Replacement using Excel Functions
Because of these shortcomings, it is easier to create random samples, with or without replacement, using standard Excel functions. In fact, it is even easier to create such samples using Real Statistics worksheet functions, as we will demonstrate shortly.
Example 2: Recreate Group 1 from Example 1 without allowing any duplicates.
We accomplish this by creating a worksheet as shown in Figure 3.

Figure 3 – Creating a random sample without replacement
Column A consists of the data elements in the population (as taken from Figure 1). Column B consists of random numbers between 0 and 1. These are generated by entering the Excel function RAND() in cell B4, highlighting the range B4:B23, and pressing Ctrl-D. This will place the formula =RAND() in every cell in the range B4:B23.
Finally, create column C by putting the following formula in cell C4 and then copying it down (using Ctrl-D as described above) for as many rows as you want elements in the sample.
=INDEX(A$4:A$23,RANK(B4,B$4:B$23))
See Built-in Excel Functions and Table Lookup for more information about the INDEX function.
Sampling with Replacement using Excel Functions
To generate a sample of size six with replacement, place the following formula in cell C4 instead. Note that column B is not necessary.
=INDEX(A$4:A$23,RANDBETWEEN(1,COUNT(A$4:A$23)))
Real Statistics Worksheet Capabilities
Click here for a description of the Real Statistics data analysis tool and worksheet functions that simplify the task of creating a random sample in Excel.
Examples Workbook
Click here to download the Excel workbook with the examples described on this webpage.
References
Chuza, E. (2016) Use the Sampling Analysis tool in Excel to easily select random numbers. Sage Intelligence
https://www.sageintelligence.com/tips-and-tricks/excel-tips-tricks/2016/02/sampling-analysis-tool/
This is a helpful article; I don’t understand excel very well, but I am a teacher needing a program to randomly select student’s names from a list without replacement, and then after I’ve called on everyone in the class, start over again. Is there a way to do this? I am looking for the fastest, cleanest system.
Thank you!
Rebecca,
Example 2 shows how to do this in Excel.
The SHUFFLES function accomplishes the same thing more easily.
Charles
Hello, I have followed your instructions but what I want is one time to create 15 samples per person. Example, person A has 100 data, person B has 150 data, person C has 80 data, person D has 50 data. I want the formula to generate one time for the 4 persons (A,B,C,D). The sample above is fixed with one criteria and one interval. I want result for the 4 person with 10 samples will be generated.
Thank you for the help.
Lalaine
Lalaine,
The Real Statistics website describes a few approaches for creating a sample. You can use any of these approaches four times, one for each person.
Charles
Hie Charles, i have a data sheet of upto 5400 items, i want just 84 but would want those randomly or periodically selected to be highlighted so i don’t have to search for them in such a huge population
Dio,
This the type of capability that was demonstrated in Example 2.
Charles
Hi Charles,
Many thanks for explaining this function. It was really useful. I have a quick question for you. I wanted to select, by following your Example 2 above, a random sample of size 100 from a dataset including 432 prices . My “Sample 1” included seven 0s, although the dataset does not include any 0. Could you please suggest what I am doing wrong here?
Kind regards,
Ashique
Ashique,
I can’t answer your question without seeing your data. It is possible that blanks are being interpreted as zeros.
Charles
Not really, as the data includes no blanks or zeros. How can I send you the data for your quick look?
Ashique,
If you send me an Excel file with your data and calculations I will try to figure out what is going on.
You can find my email address at Contact Us.
Charles
Hello Charles, I would like your help, I work for QA in the shipbuilding Industry, and need to do a sampling plan to find out for instance.
Let’s say I am trying to see the best way to predict , if I have to inspect X number of welds in a equipment , how can I predict the number of welds to inspects in future equipments so I don’t have to do 100% inspection.
Andres,
I believe that I have one or two examples of this type on the website, although I can’t recall where they are.
First, you need to define the criteria you are using for a “successful” weld. Next, if you aren’t going to do 100% inspection, you have to decide how much error you are willing to tolerate. The sample size will be based on these criteria.
Charles
Thank you Sir.
Andres
I am trying to model a 2-card hand in excel using the rand() function. I want to run 5000 trials of 2-card hands and see how blackjacks appear.
Shashwat,
A card from a 52 card deck can be modeled as an integer from 0 to 51. If n is the card drawn then (n\4)+2 = the rank of the card drawn (where 11 = Jack, 12 = Queen, 13 = King and 14 = Ace) and n\13 represents the suit (where 0 = clubs, 1 = diamonds, 2 = hearts, 3 = spades).
To draw one card at random, you can use the function =RANDBETWEEN(0,51).
To generate 5000 draws of two cards, you can enter the Real Statistics array formula =SHUFFLE(ROW($A$1:$A$52)-1) in range B1:C1 and press Ctrl-Shft-Enter (this represents a draw of two cards). Next highlight the range B1:C5000 and press Ctrl-D to generate the 5,000 random draws.
You can now create a formula (using IF) to test whether a pair of cards is a blackjack. A blackjack occurs when one card has rank = 14 and another has rank from 10 to 13.
Note that the probability of getting a blackjack (assuming one deck of cards) is 16/52 * 4/51 + 4/52 * 16/51 = 32/663 = 4.8265%. Thus, you should expect to get on average 32/663 * 5000 = 241.3273 blackjacks in 5,000 hands.
Charles
Charles, I have a data set, 15 columns and 54,000 rows. I would like to create and random and representative sample. Can you specify the function to do so? Thank you.
Jason,
Are you looking for a sample of say size 100 from the 54,000 rows of the data set? If so, then here is an approach for doing this.
Suppose that the data in the data set is in the range A1:O54000. Then enter the following array formula in range Q1:AE1 (15 columns):
=INDEX($A$1:$O$54000,RANDBETWEEN(1,54000),) and press Ctrl-Shft-Enter. This will take one row from your data set and put it in range Q1:AE1. If you want a sample of size 100, then highlight the range Q1:AE100 and press the Ctrl-D key to copy this formula 100 times.
Charles
we must test on a random basis, with 95% confidence level emergency windows. We have 215 cars with 16 windows each and every car has to be tested not to exceed 184 days. Can we use 18 as a population but that gives a high margin of error unless we do all windows which is against the rules it must be a random sample. If we use 3440 then some cars may be missed within the 184 days. How would I populate excel to reach all goals?
Lew,
Sorry, but you need to explain the scenario better, especially you need to describe what are the goals that you are trying to test.
Charles
Hi! please tell me how to decide what is the minimum no of samples that should be taken in a experimental work. the experiment have to have two groups. control and experimental group. Students achievement for a teaching method is to be measured for two different contents. so two separate achievements are designed. what should be the no of samples in each group?
thanks
If you are using the t test, then the sample size can be determined as described on the following webpage:
https://real-statistics.com/students-t-distribution/sample-size-requirements-t-tests/
You can also use the Real Statistics Statistical Power and Sample Size data analysis tool as described on the webpage
Statistical Power and Sample Size Tool
Charles
Thanks..
hi thanx for the previous info but when i do that it simply gives me the range 1-12 shuffled upto 4 times, what i wanted is true sampling without replacement, if 1-4, 5-8, 9-12 are chosen first round then 1,5,10,3 , then 2,7,12, 8 , lastly 4,6,9,11 and so on the permutations must exhaust the range of 1-12 in different permutations of 4s but finish the range before moving forward so in three different permutations 1 must appear once then again when the cycle restarts, but in a different permutation
Musa,
This is described on the referenced webpage. E.g. Put the values 1 through 12 in the range A1:A12 and then put the Real Statistics array formula =SHUFFLE(A$1:A$12) in range C1:12. This will give you a permutation of the values 1 through 12. If you want a second such permutation, place the same array formula =SHUFFLE(A$1:A$12) in range C13:C25. You can repeat this as many times as you like.
Charles
hello i would like to know how sample from range i need it to be random but aswell as contained, by that i mean say a range of 1-12 choosing 4 per time until range finished and repeat with different combinations eg first is 1,2,3,4 then second 5,6,7,8 and third 9,10,11,12 then second cycle can be say first 1,6,9, 12 secon 3,5,8,10 and thirdly 2,4,6,11 and so on the cycle must exhaust the range the start again different combinations every time please help if possible.
It sounds like you can accomplish this making multiple calls to the Real Statistics SHUFFLE function (which is described on the referenced webpage).
Suppose you want 8 such cycles (or 4 elements each). Place the numbers 1 through 12 in the range A1:A12. Then place the array formula =SHUFFLE(A1:A12) in the range C1:C12. Place this formula in the range C13:C24 and again in the range C25:C32. The range C1:C32 has the result that you are looking for.
Charles
Thank you
Thank you so very much for this tutorial. I have a dataset and am randomly selecting groups of 4 people and averaging their responses together. I’m doing this many times to create a lot of random combinations of 4 people. However, I need to keep responses from each person together. To achieve this, I essentially need to be able to randomly select a row of cells and keep those answers together (1 row=answers from 1 person). Is there a way to do this? I’ve tried a few different ways without success.
Thanks!
Sorry, but you need to provide more details before I am able to answer your question.
Charles
Thank you for the information. When using the RAND() function, users just need to be aware that closing the document and reopening (or any other update job) will refresh the results. A quick copy/paste special…values will prevent this issue from occuring but will obviously overwrite the function.
God bless you
Thanks