Objective
In Simulation, we show how to create a sample from a known distribution using Monte Carlo simulation. This can be done in Excel using a formula of form =XYZ(RAND(), …) where XYZ is a worksheet function such as NORM.INV, WEIBULL_INV, etc.
We can also use Monte Carlo simulation to estimate the values of a distribution that is not supported by Excel or Real Statistics.
Simulation Example
For example, suppose the random variable x = the number of tosses of a single die required before all six sides have been displayed at least once.
First, we create a sample of 2,000 randomly generated values of x, and then use the Real Statistics Frequency Table data analysis tool to estimate the pdf values for the distribution of x.
The first 10 elements in the random sample is shown in column AZ of Figure 1, with the entire sample in range AZ2:AZ2001. Each row in the figure represents a series of 50 throws of the die, with each value representing one throw of the die. E.g. for the first row, 4 (cell A2) comes up on the first throw of the die, 2 (cell B2) comes up on the second throw, etc. until 1 (cell AX2) comes up on the 50th throw. We can see that by the 18th toss (cell R2), all six values have appeared. This corresponds to the value in cell AZ2. The situation is similar for all the other 1,999 rows.
Note that we generate 50 values for each row, even though fewer will be needed (only 18 were needed for the first row). We do this since we estimated that seldom more than 50 throws of the die would be needed to obtain all six values.
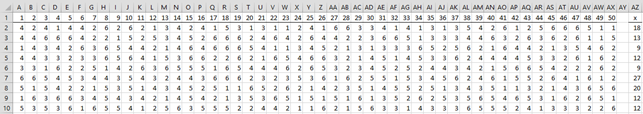
Figure 1 – Random sample
We can use the Excel formula =RANDBETWEEN(1,6) for each cell in the range A2:AX2001. Alternatively, we can use the Real Statistics formula =RANDOM(1,6,TRUE). The formula in cell AZ2 is as follows (and similarly for the other values in column AZ):
=MAX(MATCH(1,A2:AX2,0),MATCH(2,A2:AX2,0),MATCH(3,A2:AX2,0), MATCH(4,A2:AX2,0), MATCH(5,A2:AX2,0),MATCH(6,A2:AX2,0))
where the MATCH function is as described in Table Lookup Functions.
Analysis
We now copy the values in the range AZ2:AZ2001 to a new worksheet. This is done by highlighting range AZ2:AZ2001, opening a new worksheet, selecting Home > Clipboard|Paste, and then choosing the Paste Values option. We do this to make sure that the 2,000 sample values don’t change.
Next, we use Real Statistics’ Frequency Table data analysis as described in Example 3 of Discrete Probability Distributions (leaving the Bin Size field blank). We also add cumulative distribution values. This output is shown in Figure 2.
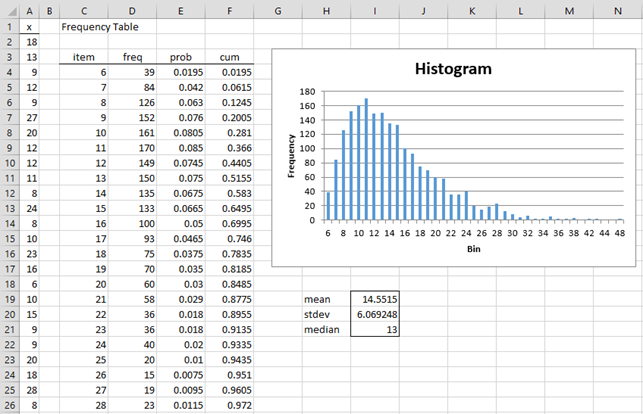
Figure 2 – Probability distribution
Only the values of x up to 28 (cell 26) are displayed in the figure. For this sample, there are values of x from 6 to 48 (and so a cutoff of 50 was a reasonable choice). We see that based on the sample, the probability that it will take 11 tosses to get all six values is 8.5% (cell E9) and the probability that it will take at most 11 tosses is 28.1%.
Analytic Approach
Note that these are estimates based on the given sample of 2,000 elements. The exact probability values are not determined, but we expect them to be similar to these values. In Example 2 of Geometric Distribution Examples we will derive an exact value for the mean and standard deviation of the distribution for x.
Examples Workbook
Click here to download the Excel workbook with the examples described on this webpage.
Reference
Excel Easy (2021) Random numbers
https://www.excel-easy.com/examples/random-numbers.html