We now describe how to estimate the tetrachoric correlation coefficient, i.e. the polychoric correlation coefficient for 2 × 2 contingency tables. In what follows we assume that the contingency table has 2 rows and 2 columns where the element in the ith row and jth column is aij.
Method 1
An estimate for the tetrachoric correlation is given by (method 1):
when aij > 0 for all i, j. If a21 = 0 or a12 = 0 then ρ = 1. If a11 = 0 or a22 = 0 then ρ = -1.
When aij > 0 for all i, j, the asymptotic variance is estimated to be
Another commonly used estimate for the tetrachoric correlation is given by (method 2):
![]()
Also![]()
where![]()
hi = NORM.S.DIST(NORM.INV(pi),FALSE)
Method 1 Example
Example 1: Calculate the tetrachoric correlation coefficient for the data in the 2 × 2 contingency table (range B4:C5) of Figure 1.
Figure 1 – Tetrachoric correlation using Solver
Using Solver, as we did for Example 1 of Polychoric Correlation using Solver, we calculate the tetrachoric correlation coefficient ρ = .364.
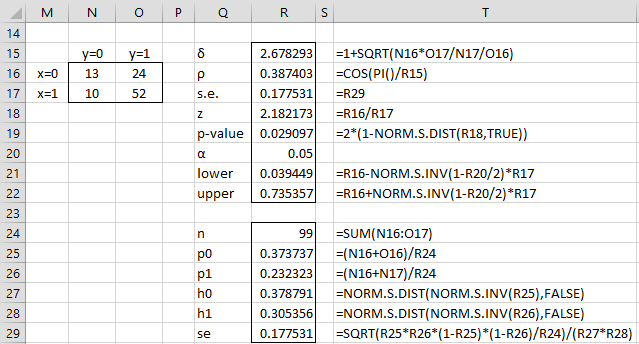
In Figure 2, we calculate an estimate of the tetrachoric correlation coefficient using method 1. This time we also calculate an estimate for the standard error, the 95% confidence interval for the tetrachoric correlation coefficient, and test the null hypothesis that the tetrachoric correlation coefficient is equal to zero.
Figure 2 – Tetrachoric correlation using method 1
We see that ρ = .386 and that the null hypothesis is rejected.
Method 2 Example
In Figure 3, we repeat the same analysis using method 2.
Figure 3 – Tetrachoric correlation using method 2
Examples Workbook
Click here to download the Excel workbook with the examples described on this webpage.
References
Uebersax, J. S. (2015) Introduction to the tetrachoric and polychoric correlation coefficients
http://www.john-uebersax.com/stat/tetra.htm
Mahler, C.M. (2016) The tetrachoric correlation coefficient
https://eigenblogger.com/tag/tetrachoric-correlation-coefficient/
STATA (2017) Tetrachoric correlations for binary variables
www.stata.com/manuals13/rtetrachoric.pdf


Hello Mr. Zaiontz,
I was wondering what I should do if any of my contingency tables contains the value of 0. Does that render it impossible to calculate?
Kind regards,
Thierry
Hello Thierry,
I just used the TCORREL function to calculate the tetrachoric correlation for the contingency table in Example 1 where I changed one of the values to 0. The result was 1 or -1. For method 1, it is not possible to calculate the standard error.
Charles
Dear Charles,
Thank you for your explanation. I started by calculating a tetrachoric correlation matrix in SPSS using the MACRO provided by Lorenzo-Seva and Ferrando (2012) (“TETRA-COM: A comprehensive SPSS program for estimating the tetrachoric correlation.”). I noticed that all negative correlations were not significant, despite some of them being rather high, and that all positive correlations are significant, despite some of them being close to zero. This seemed strange to me, so I was looking for another way to calculate the tetrachoric correlations and I stumbled upon your page.
I have tried to implement your method, but I have a few questions: (1) there are quite large differences in the p-value between Figure 2 and Figure 3. Why is that and which method should I use? (2) When I try to put the NORM.S.INV formula into SPSS, I am not allowed to do it your way, it suggests to use a ; instead of , before FALSE/TRUE. What should I do? (3) do you have any experience with the macro for SPSS? I want to do it correctly but I am not a statistician and I am getting confused. Thank you very much in advance! Amber
Hi Amber,
I don’t use SPSS and so I can’t give any advice about how to calculate the tetrachoric correlation using SPSS (issues 3). Regarding issue 2, some versions of Excel use commas and others use semi-colons. This depends on whether a comma is used as the decimal symbol in your country (in which case a semi-colon is used to separate arguments in formulas). I don’t know whether SPSS adheres to this approach, but perhaps it does.
Regarding issue 1, the p-values don’t seem that different, but I can’t say that this is not the case when using other data. I don’t know which method is more widely used nor which version SPSS uses. I suggest that you find an example in a paper from your field and use the Real Statistics to calculate the value using both methods; hopefully the resulting value of one of these methods will match the results in the paper. I realize that this isn’t always so easy since it is often different to get the raw data.
Charles
Hi,
When I put the same values and formulae from Figure 2 into Excel, the p-value that I get (cell R9) is .870. Are you sure that your image is showing the correct Excel formula?
Cheers
Tim,
The formulas in the cells were and are correct, but the display of the formulas was incorrect. I have now fixed this on the webpage, and so you should be able to get the same results.
Thanks very much for catching this error. I really appreciate your help in improving the website.
Charles
Hi,
Can you tell me what the symbol in figure 3, Q15 represents please?
Thanks
Samantha,
It is defined earlier on the webpage.
Charles