Basic Concepts
Kendall’s coefficient of concordance (aka Kendall’s W) is a measure of agreement among raters defined as follows.
Definition 1: Assume there are m raters rating k subjects in rank order from 1 to k. Let rij = the rating rater j gives to subject i. For each subject i, let Ri = 

Now, define Kendall’s W by
![]()
Observations about the formula for W
For each rater j
 and so the mean of the Ri can be expressed as
![]()
By algebra, an alternative formulation for W is
![]() where
where
![]() If all the raters are in complete agreement (i.e. they give the same ratings to each of the subjects) then
If all the raters are in complete agreement (i.e. they give the same ratings to each of the subjects) then
![]() But
But
![]()
(see proof of Property 2 of Wilcoxon Rank Sum Test), and so
![]()
If all the Ri are the same (i.e. the raters are in complete agreement), then as we have seen, W = 1. In fact, it is always the case that 0 ≤ W ≤ 1. If W = 0, then there is no agreement among the raters.
Hypothesis Testing
Property 1: When k ≥ 5 or m > 15, m(k–1)W ~ χ2 (k–1).
We can use this property to test the null hypothesis that W = 0 (i.e. there is no agreement among the raters).
Example 1: Seven judges rank order the same eight movies with the results shown in Figure 1. The average rank is used in cases of ties. Calculate Kendall’s W for this data and test whether there is no agreement among the judges.
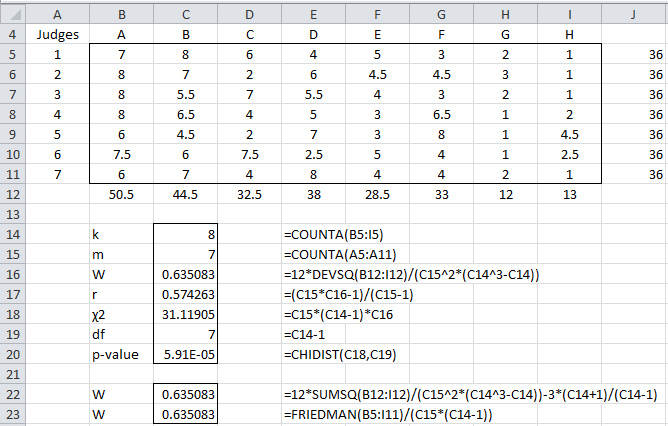
Figure 1 – Kendall’s W
We see that W = .635 (cell C16), which indicates some level of agreement between the judges. We also see that (cell C18) and that the p-value = 5.9E-05 < .05 = α, thereby allowing us to reject the null hypothesis that there is no agreement among the judges.
Note too that we calculated the sums of the values in each row of data to make sure that the data range contained ranked data. Since there are 8 subjects, the sum of rankings on each row should be 1 + 2 + ∙∙∙ + 7 + 8 = 8 ∙ 9 / 2 = 36, which it does.
Observations
W is not a correlation coefficient, and so we can’t use our usual judgments about correlation coefficients. It turns out, however, that there is a linear transformation of W that is a correlation coefficient, namely
![]()
In fact, it can be shown that r is the average (Spearman) correlation coefficient computed on the ranks of all pairs of raters.
For Example 1, r = .574 (cell C19).
In cell C22, we show how to compute W based on the alternative formulation for W given above. What is quite interesting is that the χ2 value for W given above is equal to the χ2 value used for Friedman’s test. Since we can calculate that value using the supplemental formula FRIEDMAN(R1), by Property 1, it follows that
![]()
For Example 1, this calculation is shown in cell C23.
Worksheet Function
Real Statistics Function: The Real Statistics Resource Pack contains the following array function:
KENDALLW(R1, lab, ties): returns a column vector consisting of W, r, chi-square, df, and p-value where R1 is formatted as in range B5:I11 of Figure 1. If lab = TRUE, then instead of a 5 × 1 array, the output is a 5 × 2 array where the first column consists of labels; default: lab = FALSE. If ties = TRUE, the ties correction as described below is applied (default = FALSE).
For Example 1, KENDALLW(B5:I11, TRUE) returns the output shown in Figure 2.
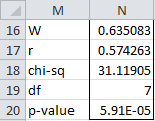
Figure 2 – KENDALLW output
Data Analysis Tool
Real Statistics Data Analysis Tool: The Reliability data analysis tool supplied in the Real Statistics Resource Pack can also be used to calculate Kendall’s W.
To calculate Kendall’s W for Example 1, press Ctrl-m and select the Interrater Reliability option from the Corr tab of the Multipage interface, as shown in Figure 2 of Real Statistics Support for Cronbach’s Alpha. If using the original interface, then select the Reliability option from the main menu and then the Interrater Reliability option from the dialog box that appears, as shown in Figure 3 of Real Statistics Support for Cronbach’s Alpha.
In either case, fill in the dialog box that appears (see Figure 7 of Cohen’s Kappa) by inserting B4:I11 in the Input Range and choosing the Kendall’s W option. The output is similar to that shown in Figure 2.
The Real Statistics Interrater Reliability data analysis tool also contains a Kendall’s W with ties option. When this option is selected, the ties correction described next is applied.
Handling Ties
The definition of W is appropriate unless there are a lot of ties in the rankings. In this case, we use the following revised definition of W.
Definition 2: For each rater j, define
where the g are all the groups of tied ranks for rater j and tg = the number of tied ranks. E.g. for judge 1 in Example 1, there are no ties, and so T1 = 0. For judge 2, there is one group of tied ranks (for 4 and 5), and so T2 = 23 – 2 = 6. Similarly T3 = T4 = T5 = 6. For judge 6, there are two such groups, and so T6 = 6 + 6 = 12, and for judge 7, there is one group with three ties (3, 4, 5), and so T7 = 33 – 3 = 24. Thus, T = 0 + 6 + 6 + 6 + 6 + 12 + 24 = 60.
Now define W as follows.
![]()
Example with Ties
Example 2: Repeat Example 1 taking ties into account.
The calculations are shown in Figure 3.
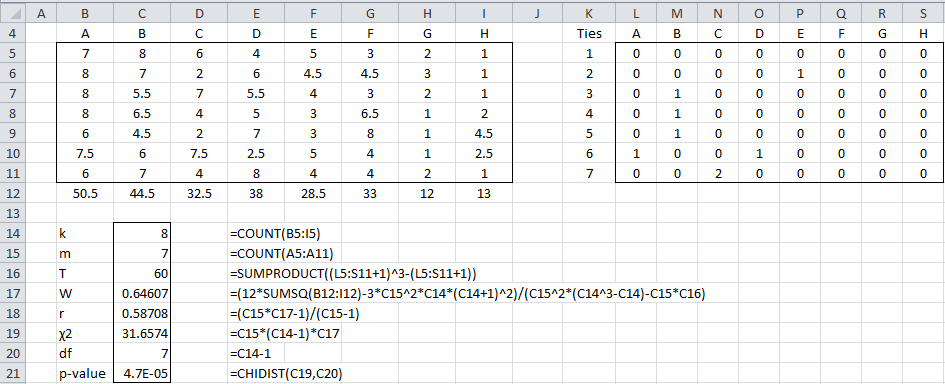
Figure 3 – Kendall’s W with ties
Here we handle the ties using the same approach as in Example 3 of Kendall’s Tau. In particular, the non-zero cells in each row of the range L5:S11 will correspond to the first element in a group of ties. The value of each such cell will be one less than the number of ties in that group. E.g. cell L5 contains the formula
=IF(COUNTIF($A5:A5,B5)=0,COUNTIF(C5:$J5,B5),0)
If you highlight the range L5:S11 and press Ctrl-R and Ctrl-D, you will fill in the whole range with the appropriate formulas. This works provided the cells in A5:A11 and J5:J11 are blank (or at least non-numeric). Cell C16 will contain the formula to calculate T.
We see that the value of W hasn’t changed much even though we have quite a few ties.
Examples Workbook
Click here to download the Excel workbook with the examples described on this webpage.
Links
References
Legendre, P. (2005) Species Associations: The Kendall Coefficient of Concordance Revisited. American Statistical Association and the International Biometric Society Journal of Agricultural, Biological, and Environmental Statistics, Volume 10, Number 2, Pages 226–245
https://pdodds.w3.uvm.edu/files/papers/others/2005/legendre2005a.pdf
Wikipedia (2014) Kendall’s W
https://en.wikipedia.org/wiki/Kendall%27s_W
Hi Charles, Can you help me?
Junel,
What help do you need?
Charles
can W be used to identify and analyse institutional constraints, and how?
Romeo,
Your question is not clear enough for me to answer.
Charles
Hello Charles.
Thanks for all those very interesting posts.
I’ve some issues with the Kendall W test
I’ve a sheet of data from 10 experts scoring 64 items on a 1 to 9 likert scale (9=very important).
I wanted to use kendall W but there is a lot of ties (lots of 8 and 9), so i tried the kendall W with ties from your real statistics resource pack but it doesn’t work (i have Excel for Mac). I tried it more manually using the formulas provided by your exemple worksheets but excel returns me a negative value of W, which seems impossible…
How can i do?
Should I use a correction using RANK.AVG in this case, and a ranking in reverse order (9 = most important)?
Thanks for your help.
Louis
France.
Louis,
If you send me an Excel file with your data and any calculations that you made, I will take a look at it and try to figure out why you are getting a negative value.
You can get my email address at Contact Us.
Charles
Hello Charles
Thank you so much for all those posts that are really enlightening.
However, I have somme issues concerning the Kendall W with Ties in the Real statistics Resource Pack.
I have an excel sheets with 10 experts scoring 40 items on a likert scale from 1 to 9.
There is a lot of ties. I tried to apply the Kendall W with ties but it doesn’t work and #VALUE! appears. I don’t understand why… Can you help me?
Thanks.
Louis
France
Louis,
If you send me an Excel file with your data and analysis I will try to figure out what is going wrong. You can find my email address at Contact Us.
Charles
Hi Charles,
It’s my first time using statistic analysis in research and your website is very helpful.
However, I have the same problem with Louis, I have 100 respondent scoring 7 items on a likert scale 1-5, and there are many ties. I got the same #VALUE! when I apply Kendall’s W with ties. Could you advise me on this?
Thank you so much for your kind attention.
Rikka,
Are you also using the Mac version of the software?
Charles
No, I use the microsoft version
Rika,
Yes, Excel is made by Microsoft, but are you using a Windows version of Excel or a Mac version of Excel?
Charles
ah I mean the windows one,
Rika,
Thanks. If you send me an Excel file with your data and analysis I will try to figure out what is going wrong. You can find my email address at Contact us.
Charles
Hello Charles,
I’m doing with my thesis using the Kendall’s W and I’ve already got the result of W based on my questionnaires. However, I think I need a table of critical value to compare with my result in order to know if it has the concordance or not. But I can’t find this table on the Internet, could you please help me to find out the table?
Thanks a lot!
Chen.
Chen FU,
In general, you don’t need a table of critical values. Instead you can use the chi-square test described on the referenced webpage.
Charles
Dear Charles,
Thank you for you webpage and the help you give to people.
I am writing to you because I have a few doubts about my current research. I tried to investigate to what extent a group of five teachers agreed with a teaching technique and if teachers agreed among themselves. I built a scale made up of eight Likert items. Each likert item has three options: a positive one (it was computed as 3 points), a neutral one (it was computed as 2 points) and a negative option (it was computed as 1 point). I wondered if the following analyses were OK or I am missing something. First, I checked the reliability of the scale. The alpha was over .9 and all item-total correlations were over .3. Then, I summed the scores on each item to know the total score of each teacher. I interpreted that those teachers that have a score closed to the maximum score (8×3=24) considered that the teaching technique is positive and that those that have a score closed to the minimum have a negative view. I thing that so far so good. However, here I have a doubt. May I sum all teachers scores and divide that number by the number of teachers (5) to obtain a global score and interpret it the same way, that is, if it is closed to 120 (24×5) it means that globally teachers consider that the teaching technique is positive? To try to answer the second question (if teachers agreed among themselves), may/ should I use Kendall W?
I ask those questions because I have a scale made up of likert items with only three points (though it is enough for my purpose) and I found some controversy about how to analyse likert items and likert scales. Also I found some confusion between Cronbach alpha and Kendall W.
Thank you very much.
Best regards,
Juan
Juan,
I don’t see any problems with your approach. You can use Kendall’s W to measure agreement among teachers. Cronbach’s alpha is not used to measure agreement and so it is different from Kendall’s W.
Charles
Dear Charles,
Thank you.
Best wishes,
Juan
Hello, i am really grateful for this website. how do i calculate for F-test if i want to use the F-test to test for the significance and not the Chi-square. on spss or any related software
i will really appreciate your help a lot.
Why is it important to use the F statistic instead of chi-square?
Charles
Dr. buenos días, Dr es posible realizar, hacer la transformación de Box Cox usando Real Statistics?
Dear Dr. good mornig. Excuse Dr. It is possible, to do Box Cox transformation with Real Statistics
Thanks.
Gerardo,
You are the third person in the past week who have asked this question. The case where lambda is 0 or 1 are supported. See Power Regression for the case where lambda = 0 and Linear Regression for the case where lambda = 1.
The other cases are not supported, but I will add this soon.
Charles
Thak you very much Dr.
Estimado Dr. disculpe mi ignorancia, que es la diferencia entre Fleiss Kappa y W Kendall? o los dos estadìsticos miden lo mismo?
Dear Dr. excuse me my ignorance, which is the difference between Fleiss Kappa and W Kendall? Or the both statistics measure the same?
Gerardo,
They are not the same. E.g. Fleiss Kappa is used with ratings that are categorical (nominal), while Kendall’s W is used with ratings that are ordinal.
Charle
Dear charles’
I want to know that canwe use kendall w for more than 20 rankers.
Yes you can.
Charles
Please help me what is the advantage of using The Correlation Between Several Judges and Criterion Ranking Tc than using Kendall coeffiecient of agreement u and W? Asap! Please, Help me.
Sorry Jessica, but I am not familiar with the term Criterion Ranking Tc.
Charles
Good Day!
My W is -3.77073 while my p-value is 0.
Did I do something wrong? or is it really possible to have this kind of answer.
And also, there doesn’t seem to be a Friedman on my excel. Is there any alternative for that?
Thanks and I hope you reply ASAP
Jess,
W = 12*R/(m^2*(k^3-k). Since R is a sum of squares it is non-negative. m^2 is also non-negative. Since k is a positive integer, k^3-k will be non-negative. Thus W should be non-negative, and so I don’t see how you obtained a negative value.
You don’t need to calculate Friedman since the formula in cell E22 of Figure 1 of the referenced webpage gives an alternative formula which doesn’t depend on Friedman.
If you send me an Excel file with your data and calculations, I will try to figure out why you are getting the results that you have reported. See Contact Us for my email address.
Charles
Dear Charles,
How can I account for missing data values? For instance, if some of the judges haven’t seen some of the movies.
Many thanks for this excellent resource.
Adam,
Sorry, but I don’t have any great advice as to what to do when some judges haven’t evaluated all the subjects. I can only think of two approaches: (1) eliminate such judges from the calculation (listwise deletion) or (2) use a different measure. Choice (1) is not great since you are throwing away some (maybe even all) of the data. I don’t have any specific recommendations for substitute measures either. This depends on the type of evaluations being made (categorical, ordinal, interval).
Charles
hello
is there a similar test in Spss software?
Can you help me to learn who can I do this test by means of Spss?
Sorry but I don’t use SPSS and so can’t help you with this.
Charles
thank you so much.
I found the Spss procedure:
Analyze> Nonparametric Tests > Legacy Dialogs > K Related Samples > kendall’s W
Dear Charles,
Thank you so much for your great website and your calculation schemes!
Do you maybe know, if it is possible to calculate Kendall’s w, if the m raters do not rank all k subjects, but only select their TOP3 most important subjects (unranked!) from a list?
I’m just curious, because today I read an article saying that when only a certain number (z) of subjects is selected (e.g., 3), each of the selected subjects would have the rank 1 and the non-selected remaining subjects would have a z+1 rank (3+1=4).
Thanks a lot in advance for your kind support!!
Michael
Michael,
I am not familiar with this situation, although there may be a way to do it.
Glad you like the website. Stay tuned. I add more information all the time.
Charles
Hello Charles
Great website! It saves my life right now!
I have two questions related to a study I am doing currently.
I collected ideas on how a technology might influence a current business model with the help of 5 experts. I consolidated the ideas to certain areas (product, customer etc.). In a second round I am planning to ask the experts to rank (or rate) the ideas within the area. Unfortunately, I have only 2 comparable ideas to rank in certain areas.
I read in several papers that in case of n<7 the Chi square is not recommended to use.
If I let the ideas be ranked by the experts (within those areas with only 2 ideas), can I still use Kendall W to measure the concordance? Is there another test that I can use instead of Chi square?
I do still have the option to let the ideas be rated instead of ranked and I have read about the ICC calculation, which would makes more sense in case. Would you recommend me to do that instead of a ranking?
Many thanks in advance!!
Marina
Marina,
It is difficult for me to provide much feedback, since I don-t really have a full grasp of the scenario. I understand there are 5 raters, but I don’t know how many subjects are being rated or what sort of rating measurement you are using (e.g. assignment to category or a Likert scale value or a decimal value). If there are only two subjects then you shouldn’t expect too much from whichever approach you use.
Charles
Hello Charles,
My W, is close to 0 (0.000599742), and my p-value is 1, do I reject or accept the null?
Regards,
Uche
The null hypothesis is that there is no agreement between the raters. Since p-value is 1 then you can’t reject this null hypothesis. Statistician don’t use the word “accept” since there is always the possibility that the conclusion is wrong, although with p-value = 1 that is very unlikely. The conclusion is that it is very likely that there is no agreement between the raters.
Charles
Hello Charles,
Thank you for your assistance.
Uche
Hello Charles,
thanks for your awesome site. I’ve a question: I’ve a delphi study and I ask experts about a ranking for different subjects. So if I have subjects a, b, expert A might give [1, 2], and expert B might rank [2, 1]. Now I want to allow the experts to somehow factor in their own level of expertise. One simple approach (which doesn’t work) would be to let them each self-assess on a scale from 0 – 9 their own expertise, and then, if e.g. for subject a, expert A feels confident at a level of 9, let his values be [91,92] instead of [1,2] in the hope that this expert’s opinion should outperform that of expert B.
What would be a working approach to include expertise?
Thanks!
I don’t know how you could do this using Kendall’s W. You might have more success with a weighted approach using the Intraclass Correlation Coefficient.
Charles
Dear Charles,
I was training to determine the various risk management practices used by rice farmers in a particular area using the Kendall coefficient of concordance. A 4 point likert scale was used.
These are the Kendall Mean rank I got;
Property Insurance 3.13
Diversification of enterprise 2.29
Diversification of source of income 2.35
Cooperative marketing 2.80
Hedging 4.42
Please, how do I interpret this result?
Thanks
Since Kendall’s W is at most 1, I presume that the scores that you have listed are the values for R as described in Definition 1 of the referenced webpage. You now need to calculate W from R, k and m as described in Definition 1.
You can then test whether W is statistically different from 0 as described on the referenced webpage.
You can also calculate the correlation coefficient r from the values for W and m as described on the same webpage. A value of r = .1 is considered to be a small effect, r = .3 a medium effect and r = .5 a large effect.
Charles
Por ejemplo, el valor r=0,7 ¿se considera bueno, regular o malo, según el estudio realizado? ¿Usted posee una escala de valores de referencia? Gracias nuevamente.
Gracias ! Un W=1 significa un acuerdo total de las evaluaciones, bajo la misma lógica ¿ qué significa un w=0,7 ? ¿ significa que existe un 70% de las probabilidades de que las evaluaciones concuerden? Creo que no, ya que W no tiene un comportamiento lineal. De esta manera, creo que lo mejor es transformar W en r, ya que r si tiene un comportamiento lineal. Ahora,¿ Un r=0,7 significa que existe un 70% de probabilidad de que las evaluaciones concuerden? Gracias de antemano 😀
Pedro,
Thanks, now it is clear. Your logic is correct. You cannot make such an assertion about W, but you can more easily interpret the equivalent correlation coefficient r, as you have done.
Charles
Hi. I know that when the raters are in complete agreement W=1 ¿ which means a W=0,7? I need validate a method ¿is there critical values?
¿it is better to analyze the proposal linear transformation and speak in percentage terms?
Pedro,
You seem to be saying that when W=1 then W=0,7. This doesn’t make sense to me.
I don’t really understand the questions you are asking in your two comments. Perhaps it would be better if you asked your questions in Spanish.
Charles
Dear charles,
I am using your addin for my MBA thesis. A great tool by the way!
See below the findings for 2 rounds of ranking. Kendall’s W shows an increase suggesting that we the level of agreement is increasing. However are the results siginificant? I do not know how to interpret the P-values.
Round 1
W 0,093270366
r 0,002597403
chi-sq 7,181818182
df 7
p-value 0,410197881
Round 2
W 0,269578906
r 0,196536797
chi-sq 20,75757576
df 7
p-value 0,004146017
Joey,
I’m not sure why you need to statistically compare Kendall’s W values, but I don’t know of any test for this. Since you are comparing two chi-square statistics, you might be able to use an F-test for this (similar to comparing two variances), but I’m not really sure whether this applies here.
Charles
Hi Charles,
I am comparing the change in Kendall’s W since I am following the delphi method. In this method you go for multiple rounds of ratings by the experts until you reach some plateau in level of agreement (or pissed of judges;). So I know how to interpret the W values.
Just to be sure:
First round W = 0,09–>means: very low consensus (Schmidt, 1997)
Second round W = 0.27–>means: low consensus (Schmidt, 1997)
However I do not know how to interpret the P-values (0,41 for the first round and 0,004 for the second round). Do these values undermine the conclusions I have drawn above or can I just neglect them?
Hope I am asking my question the right way.
Greetz,
Joey
Joey,
Thanks for the explanation. Now it is clear.
One possible approach is to convert W into a correlation coefficient as described on the referenced webpage. Now you can determine whether there is a significant difference between the two correlation coefficients a described on the webpage Two Sample Testing of Correlation Coefficients.
Charles
Would you please hep me on data entry for seasonal calendar data analysis of some camel diseases.
Please be more specific.
Charles
Hello Sir
I am doing conjoint analysis and getting my packages ranked from most preferred to least preferred.
SPSS is giving me two statistical coefficients Pearson’s R= 0.7 at significance .001 and Kendall’s Tau=0.52 at significance .003.
I am unable to interpret the results.
Please be more specific as to the problem you are having. It sounds like you have a significant result using either statistic.
Charles
Sir basically i am unable to understand the hypothesis behind the calculation of coefficients in SPSS.
The two interpretations i could infer were
1) It states the correlation between estimated and observed data.
2) It states if the samples are independent or not.
I am confused which is the right interpretation.
For Pearson’s the hypothesis testing using the t test is to check whether the correlation is significantly different from zero (which for data which has a bivariate normal distribution is equivalent to independent). The hypothesis using the Fisher transformation is whether the correlation is significantly different from some hypothesized value (say .8).
For Kendall’s tau the hypothesis testing is to check whether the correlation is significantly different from zero.
None of this is related to Kendall’s W (the referenced webpage).
Charles
Hi Charles,
if I have 2 persons to evaluate vessel stenosis using percentage( I consider it as continuous variable), which method I should use to test agreement of inter-raters?
Thanks,
xinjian
Xinjian,
Sorry, but you haven’t provided enough information for me to answer your question.
Charles
Hello Charles,
I must use the delphi method for my masters thesis. But since this is my first experience with statistics I would appreciate some help.
In my first survey I’ll present 20 Critical Sccess Factors, and ask the panel (10 members) to classify them from 1 (least important) to 10 (most important). Then I will find Kendall’s W with your excel add-in.
The second survey will begin with the 10 most important CSF from previous survey, and ask the panel to rank each one. I’ll “translate” items ranked as 1st with 100 points; and items ranked as 10th with 10 points, so I can calculate Kendall’s W.
This second survey will be in Qualtrics option of Rank Question.
Do you think this a correct way to find Kendall’s W?
José,
First Survey: You need to rank the 20 CSF from 1 to 20 (not 10).
Second Survey: I don’t believe that you can use rankings of 10, 20, …, 100, but instead must use 1, 2, …, 10. This should accomplish what you want anyway. I am not familiar with Qualtrics option of Rank Question, but assuming that the ranking works as in Excel you should be fine.
Charles
Hey Charles,
I got the following problem with my data analysis. My W (0.307513109
) according to the first formula is slightly different from the W according to the Friedman’s Formula (0.292558479
)and the another W given by Real Statistics Tool (0.292558479
). What am I doing wrong? Or which W is right then?
Thank You,
Marta
Marta,
The difference probably depends on whether you are using the ties correction factor or not.
W without a ties correction factor can be calculated as Friedman(R1)/(m*(k-1)) = KENDALLW(R1,FALSE,FALSE). Here the third argument = FALSE and so no ties correction factor is used.
W with a ties correction factor can be calculated as KENDALLW(R1,FALSE,TRUE)
Charles
Hey,
Can somebody explain it to me what would be the interpretation of the r = .574 (cell C19) from the Example 1?
I am rather not sure if I shall add it to my results. In my case r is about 0.3 and almost the same as the W.
Thanks a lot
Marta
Marta,
Some would say that r = .574 represents a moderate association.
Charles
Hi, I was wondering whether it’d be possible to have some advice.
I am currently trying to assess the relationship between pain intensity and pain-pressure threshold. Participants are asked to fill in different pain scales prior to having their pain pressure threshold assessed, this is then repeated on the next session.
This leaves me with 2 sets of pain intensity ratings and 2 sets of pain pressure threshold per scale. So far I have calculated percentage change between the 2 and then used Spearman’s to calculate the correlation between percentage changes; however this proves minimal correlation. Would you happen to have any other suggestions of data analysis?
Kind Regards,
Josh McCollum
Josh,
Perhaps I don’t completely understand the experiment. I would like to ask a few questions to try aand understand things better.
What happens between the first pain pressure assessment and the second? Why are you expecting any change? What did you find was the correlation between pain intensity and pain threshold on the first trial? What was the correlation on the second trial? Why did you decide to use Spearman’s instead of Pearson’s or Kendall’s?
The website describes how to perform two sample correlation testing, using an approach which I believe is different from the one you described. The independent sample case is described at
Your experiment seems to be using dependent samples. This is described on the webpage
I hope this helps.
Charles
sir i want to know the formula how i can calculate concordance test fr one year witout ts rank. plz help me
The formulas for the referenced test are all on the referenced webpage. What are you missing and what do you mean by “for one year without ts rank”?
Charles
Hi Charles, the excel add-in tool available on your website is incredible. I recently came to know about it from a fellow classmate.
My question is as follows:
– I was trying to find the correlation between the returns on Private Equity investment by a bank and some of the PE indices available on Bloomberg.
– As the data points for returns on PE investment are few (quarterly for the last 10 years – 40 readings), my mentor recommended me to use the Kendall
– However I have not been able to find any literature that suggest that I should use Kendall to determine the correlation between 2 time series (where data points are limited)
– Do you think using Kendall will be right? If not, are there any better alternatives I can explore?
Appreciate your response on this.
Is he recommending Kendall’s W (as on the referenced webpage) or, more likely, Kendall’s tau? Since you are looking for a correlation coefficent, it seems like Kendall’s tau could be appropriate. There is a lot of literature references to using Kendall’s tau with non-normally distributed data (common with small samples).
Charles
Hi Chalres
Sorry, I would like to know how can I use SPSS to compute the Kendall’s coefficient W.
Thank you very much
Pov,
Sorry, but I don’t use SPSS. You can use my software (Reliability data analysis tool or KENDALLW function) in Excel to compute kendall’s W.
Charles
try this as i read from previous comment:
Analyze> Nonparametric Tests > Legacy Dialogs > K Related Samples > kendall’s W
I am using Kendall’s W-test with SPSS, but I don’t know how I can find out the null hypothesis of this test?
Joe,
Kemdall’s W is not a test and so there is no null hypothesis. It is a measure of agreement between different raters.
Charles
Hi, Charles –
Thanks for the website and the super-helpful information.
My question is about using this statistic (or ICC) with rating-scale data in a design that’s not fully crossed. For instance: 75 samples, each rated twice. 10 raters, randomly assigned various samples. What’s the best way to compute the inter-rater reliability in that case – and how do you even structure that data in SPSS or SAS? Does that affect which of the alternatives to Kendall’s W that you can use? Thanks.
Nick,
If I understand the problem correctly, it seems that Fleiss’s Kappa can be used in this situation. I don’t use SAS or SPSS, and so I don’t know how you would structure the data. YOu can use the Real Statistics software as described in https://real-statistics.com/reliability/fleiss-kappa/
Charles
Hi Charles,
What table is to use to get the critical value to compare with the value of Kendall’s coefficient of W?
If the n > 7 and if n < 7.
Kindly discuss thoroughly please.
Thanks!
Hi Charles,
Could you please show me how to attach an Excel sheet? Sorry I am not a tech-savvy person.
Thanks.
D
Dinh,
Whatever tool you use to send emails will have the ability to add attachments to your email. An Excel spreadsheet is just a file. All you need to do is attach this file to your email.
Charles
Hi Charles,
Previously I asked a question related to the negative W result. I have found that before doing the calculation, each set of tied ranks should be corrected based on the Mann-Whitney U test. When I applied this, I got the positive result.
I am looking forward to hearing your response.
Cheers,
Dinh
Dinh,
Can you send me the spreadsheet so that I can check out what happened?
Charles
Hi Charles,
I calculated Kendall’s W corrected for ties by following the above explanation and consulting the Excel sheet. I also checked with the manual method described by Sheskin, D.J. I got the same results but the W value was negative. Could you please explain to me why it was the case?
Thank you in advance.
Dinh
Hi Charles,
This webpage absolutely saves me from calculating Kendall’s W. One problem that I have experienced is the sum of rankings on each row is different from yours (36-36-36 for each row). Mine is 14-10-14 by summing the values of each row up.
Could you please help explain how we can get the number 9 in the following sentence?
“Note too that we calculated the sums of the values in each row of data to make sure that the data range contained ranked data. Since there are 8 subjects the sum of rankings on each row should be 1 + 2 + ∙∙∙ + 7 + 8 = 8 ∙ 9 / 2 = 36, which it does.”
For my case, if I use the equation =SUM(B2:E2) then the values of each row are 14-10-14 while these are 10-10-10 if I calculate =COUNTA(B2:E2)*5/2.
Thanks.
Dinh
Hi Dinh,
In this test if there are k subjects to be rated then each rater must rate one subject 1, another 2, another 3, etc. In this way the sum of the ratings for each rater will be 1+2+3+…+k, which by algebra is k(k+1)/2. For the stated example k = 8 and so k(k+1)/2 = 8 x 9 / 2 = 36.
Charles
Hello,
I have a short question: Can I use Kendall’s W for one question only? 12 experts have answered several questions (6 point Likert) and I would like to know for each of the questions whether consensus has been achieved among these 12 participants. SPSS however demands 2 variables. What is the second variable if I don’t want to compare different questions?
Thank you so much!
Hanna,
I don’t know how you would calculate Kendall’s W for only one question. Using the normal formulas you would get a df = 0 which is not good.
Charles
Hello Charles,
Thanks for the info. I’ve used sets of pair comparisons between 50 indicators to elicit the weight of each indicator using AHP. it’s running under a Delphi survey and in the first round 20 people have responded. As I didn’t asked them to rank the indicators, is it any way based on the elicited weights, I can obtain the Kendall’s coefficient to evaluate the consensus level? Thanks.
Hello, Charles,
My question is to some extent related with the previous questions regarding Likert scale.
I’m doing a pilot research on quality indicator’s relative importance. I have at least 20 indicators, divided in different groups, and the experts are assigned to evaluate each indicator from 1 to 5 comparing the particular indicator with other indicators within the same group. 1 stands for ,,indicator is not important”, 5 – ,,indicator is very important”. Having the experts’ evaluation, then I will recalculate the results to relative importance ranging from 0 to 1 (all indicators within the same group aritmetically will be totalling 1: like A indicator has a value 0,2, B – 0,3, C – 0,5).
In order to calculate W, I will rank the experts evaluations. However, as I can see now from the results, there is a dominance of 5 and 4 points in experts answers. Since many of the indicators are very important, they are evaluated at the same highest points. Turning these results in rank order, it will cause a lot of same ranks within the expert’s judgement. Will it be a problem in order to get a high and significant value of W?
Many thanks for you answer
Darius,
You can clearly translate Likert ratings into rankings using RANK.AVG, but I don’t understand where the A, B and C come from.
In any case, you can handle ties as described in Definition 2 on the referenced webpage.
Note too that depending on what you are trying to show you may find that Fleiss’ kappa or ICC may be a better fit for your needs. See the webpages https://real-statistics.com/reliability/fleiss-kappa and https://real-statistics.com/reliability/intraclass-correlation/.
Charles
me encantó!! muchas gracias!!
Quick question: What is the difference between the Kendall’s coefficient of concordance and the intraclass correlation coefficient? I already consulted your page about both coefficients but don’t really see the difference.
Thanks for your help!
-Hans
Hans,
They do seem to be measuring similar things. On difference is as follows:
The rating used in ICC captures the scale of the rating. E.g. if rater A gives ratings 1, 2, 9 to the three subjects being rated then it is clear that the magnitude of the rating for the 3rd subject is much higher than for the 1st or 2nd. In Kendall’s W this is not captured. Here rater A would give ratings 1, 2, 3 (the sum must be 1+2+3 = 6) to the three subjects.
Charles
Hello,
I urgently need to know if there is a scale to interpret the Kendall’s W values like weak, strong, very strong etc. If yes, can U please give me the reference at the earliest?
I don’t know of such a scale. You can get some idea of weak, strong, very strong, etc. by looking at the r value which is computed from W and corresponds to the correlation coefficient. Also the lower the p-value the more significantly different W is from zero.
Charles
Question:
I am analyzing 3 different rankings of “The Top 200”. There are 133 subjects that made the Top 200 list in all 3 rankings. I should mention that there are several ties in each of the rankings. I calculated Kendall’s W using SAS, and it’s = 0.78, which suggests a high level of agreement between the rankings. However, for each of the 133 subjects, I also calculated the difference between each subject’s highest rank and lowest rank (among each subject’s 3 rankings), and the average difference is 51. The median difference is 47. Standard Deviation of the difference is 34. The maximum difference is 148. Such large summary statistics suggest that there is not a high level of agreement. So I’m wondering how is the W = 0.78? This seems far too large.
You have made an interesting observation. I can’t explain this, but the difference between the highest and lowest rank is quite a coarse measurement.
Charles
R Hodges,
How did you program in SAS to find Kendall’s W?
I have 400 respondents who were given 8 statements each to rank from 1=strongly disagree to 5= strongly agree (likert scale). can i use Kendall’s W to find agreement among the respondents. Please shed some light on how to go about it..
Adam,
Yes, you can use Kendall’s W for this type of problem. Follow the approach shown in Example 1 of the referenced page. The only difference between your problem and Example 1 is that you require 400 rows instead of 7. In fact if you simply enter your data in the worksheet shown in Figure 1 of the referenced page then Kendall’s W can be calculated by the formula =FRIEDMAN(B5:I404)/(400*(8-1)).
Charles
Charles,
Thanks for your quick response to this matter. My problem however is that each respondent in the survey is not asked to rate the 8 statements (from 1 to 8).
The actual question is that a respondent is required to rank:
– statement 1 (from 1 to 5)= likert scale.
-statement 2 ( from 1 to 5) etc up to 8th statement
example:
respondent1: 5,5,5,3,2,5,1,4 for the 8th statements.
respondent2: 5,2,3,2,5,5,4,3 for the 8th statements. etc
—
Do you think I can still go ahead and use the Kendall’s W?
I feel the example given are different.
Adam
Adam,
I can think of two possibilities:
(1) Use Kendall’s W on the rankings. E.g. 5,5,5,3,2,5,1,4 turns into 6.5, 6.5, 6.5, 3, 2, 6.5, 1, 4 (using RANK.AVG or RANK_AVG)
(2) Use the Intraclass Correlation instead. It seems like a better fit for what you are trying to do – see webpage https://real-statistics.com/reliability/intraclass-correlation/
Charles
Hi Charles,
Very interesting topic, i do some beer tastings with friends and want to analyze the data, so i am reading about this, could you throw some light on which methods are good for ordinal data? (we drink “brand beers” with no distinction of type of beers).
Do you think Pearson or Spearman are adecuate to compare one judge with another? (to see which pair of judges have more affinity).
Would you mind to share this W Kendall spreadsheet? so i can adapt it 🙂
Best regards!!
Hi Pep,
If your goal is to see which pair of judges agree the most then comparing Pearson’s (or Spearman’s) correlation coefficients could be a good way to go. Depending on what you really want to analyze you could use Cohen’s kappa, which is also described on the website.
You can download a copy of the Kendall’s W worksheet (as well as other examples shown in the website) for free at https://real-statistics.com/free-download/real-statistics-examples-workbook/.
Charles
First of all thank you very much, you are sharing an amazing work!!
We are giving free scores from 0 to 10 (not ranks), and we are not assigning fixed points like your W Kendall example (and the rest i read on the internet i think), thus, one person can give 10 points to each beer and another 2 points…i attach the results here so you can understand better what i am saying. I don’t know if this example is suitable for been analyzed with these methods…
The goal would be to analyze the general agreement of the jury, compare affinity between judges…and for sure there are some other interesting statistics that could be done and i am missing 🙂
I’m going to read about the Cohen’s Kappa too, thanks again!!
Pep
Pep,
From looking at the data that you included it seems that you might want to use the intraclass correlation coefficient. See https://real-statistics.com/reliability/intraclass-correlation/ for more details.
Charles
In my research, i have used Delphi method (3 rounds) using the Likert scale. Now, I have 60 judge-experts and 11 indicators. How can i use Kendall’s W to measure the agreement among judge-expert?
You can change the Likert scale values into a rank order using the RANK.AVG function and then follow the approach in Example of the referenced page. When you say you have 11 indicators, does this mean the Likert scale is 0 to 10 or do you mean that there are 11 subjects being ranked?
Charles
hi. can you help me?
What help do you need?
my W value comes out to 0.226 and p value comes out to 0.0116.. should i reject null hypothesis(there is no agreement among raters)?
If i reject null hypothesis, i conclude that there is agreement among raters. but how much agreement? less or more?
Assuming alpha = .05, since p-value < alpha, you would reject the null hypothesis that there is no agreement. The closer W is to 1 the more agreement there is; the closer to 0 the less agreement there is. I don't know any hard and fast rules, but it seems that there is agreement, but on the low side. Charles
THANKS CHARLES.. I APPRECIATE YOUR HELP