Statistical Power
We now show how to calculate the statistical power of the test that Cronbach’s alpha is greater than some value γ0 (based on the null hypothesis) at some value γ1 (based on the alternative hypothesis). We use the approach followed numerous times elsewhere on the website using Property 1 of Cronbach’s Alpha Hypothesis Testing.
First, we calculate the right critical value of the F distribution F(df1, df2), where df1 = n − 1 and df2 = (n − 1)(k − 1).
Fcrit = 1 – F.INV(1-α, df1, df2)
By Property 1 of Cronbach’s Alpha Hypothesis Testing
![]()
By algebra![]()
Now define![]()
It then follows that power can be calculated as
1 – β = F.INV(W1, df1, df2)
Example
Example 1: Find the power of the test that Cronbach’s alpha is greater than .7 (null hypothesis) where the sample size is 100, and the number of items is 10 when we expect the Cronbach’s alpha to be .75 (e.g. because this is the value for a sample).
The analysis for a one-tailed test is given in Figure 1.
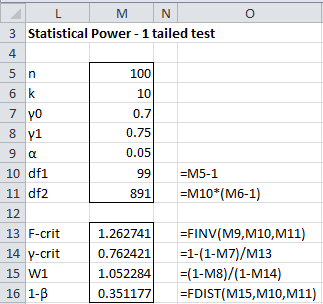
Figure 1 – Power for a one-tailed Cronbach alpha hypothesis test
We see from Figure 1 that the power of this test for Cronbach’s alpha equal to .75 is 35.1%. If γ1 is .8 instead, then the power jumps to 86.0%. If, instead, we raise the sample size to 200, then power increases to 54.6%.
The analysis for the two-tailed test is shown in Figure 2.

Figure 2 – Power for a two-tailed Cronbach alpha hypothesis test
This time, the statistical power is 24.9%.
Worksheet Function
Real Statistics Function: The following function is provided in the Real Statistics Resource Pack:
CALPHA_POWER(γ0, γ1, n, k, tails, α) = the power of Cronbach’s alpha test when γ0 = Cronbach’s alpha in the null hypothesis, γ1 = expected value of Cronbach’s alpha, n = the sample size, k = # of items, tails = # of tails: 1 or 2 (default) and α = alpha (default .05).
For Example 1, using this function we see that CALPHA_POWER(.7, .75, 100, 10, 1, .05) = .351177 and CALPHA_POWER(.7, .75, 100, 10, 2, .05) = .248619.
Sample Size Requirements
Example 2: Find the sample size required to achieve power of 90% for the test in Example 1.
We can use Excel’s Goal Seek tool to calculate this sample size. Alternatively, we can make repeated guesses as we did for Example 2 of Cronbach’s Alpha Hypothesis Testing. Instead, we will simply use the following Real Statistics function, which does this for us.
Worksheet Function
Real Statistics Function: The following function is provided in the Real Statistics Resource Pack:
CALPHA_SIZE(γ0, γ1, k, pow, tails, α) = the minimum sample size of Cronbach’s alpha test needed to achieve statistical power of pow (default .80) where the other arguments are as for CALPHA_POWER.
For Example 2, using this function, we obtain the results CALPHA_SIZE(.7, .75, 10, .9) = 698 for the two-tailed test and CALPHA_SIZE(.7,.75,10, .9,1,.05) = 571 for the one-tailed test.
Data Analysis Tool
Real Statistics Data Analysis Tool: We can also use the Statistical Power and Sample Size data analysis tool to calculate the power and sample size requirements (see Real Statistics Power and Sample Size Data Analysis Tool).
E.g. to compute the sample size for Example 2, press Ctrl-m and double-click on the Statistical Power and Sample Size option from the Misc tab and select the Cronbach Alpha and Sample Size options on the dialog box that appears. Press the OK button and fill in the Input portion of the dialog box that appears, as shown in Figure 3. When the OK button is pressed, the Output portion of the dialog will be filled in as shown in the figure.

Figure 3 – Sample size required for Cronbach’s alpha
Examples Workbook
Click here to download the Excel workbook with the examples described on this webpage.
Links
References
NCSS (2019) Tests for one coefficient alpha
https://www.ncss.com/wp-content/themes/ncss/pdf/Procedures/PASS/Tests_for_One_Coefficient_Alpha.pdf
Heo, M., Kim, N., Faith, M. S. (2015) Statistical power as a function of Cronbach alpha of instrument questionnaire items
https://bmcmedresmethodol.biomedcentral.com/articles/10.1186/s12874-015-0070-6