Basic Concepts
Sometimes linear regression can be used with relationships that are not inherently linear but can be made to be linear after a transformation. In particular, we consider the following exponential model:
y = αeβx
Taking the natural log (see Exponentials and Logs) of both sides of the equation, we have the following equivalent equation:
ln y = ln α + βx
This equation has the form of a linear regression model (where I have added an error term ε):
y′ = α′ + βx + ε
Observations
Since αeβ(x+1) = αeβx · eβ, we note that an increase in x of 1 unit results in y being multiplied by eβ.
A model of the form ln y = βx + δ is referred to as a log-level regression model. Clearly, any such model can be expressed as an exponential regression model of form y = αeβx by setting α = eδ.
Example
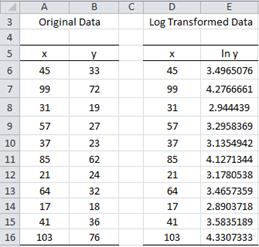
Example 1: Determine whether the data on the left side of Figure 1 fits with an exponential model.
Figure 1 – Data for Example 1 and log transform
The table on the right side of Figure 1 shows ln y (the natural log of y) instead of y. We now use the Regression data analysis tool to model the relationship between ln y and x.
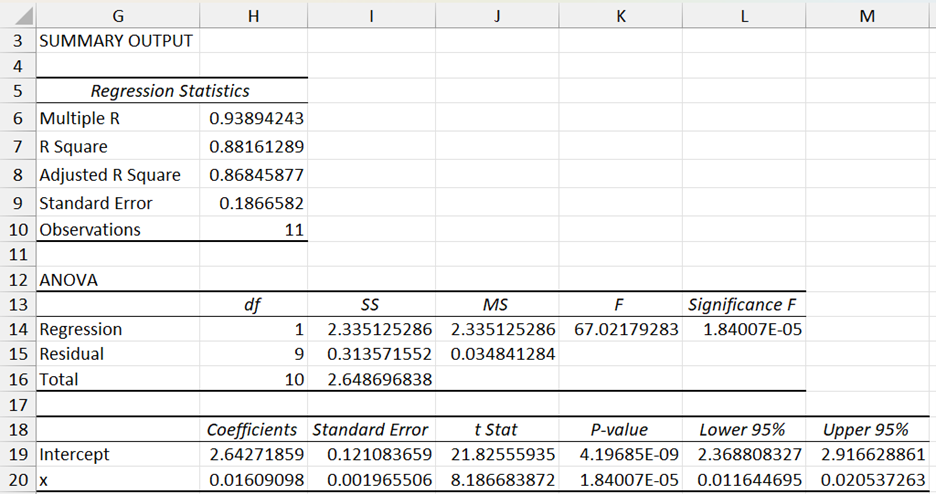
Figure 2 – Regression data analysis for x vs. ln y from Example 1
The table in Figure 2 shows that the model is a good fit and the relationship between ln y and x is given by
ln y = 2.64 + .016x
Applying e to both sides of the equation yields
We can also see the relationship between x and y by creating a scatter chart for the original data and choosing Layout > Analysis|Trendline in Excel and then selecting the Exponential Trendline option. We can also create a chart showing the relationship between x and ln y and use Linear Trendline to show the linear regression line (see Figure 3).
Figure 3 – Trend lines for Example 1
As usual, we can use the formula y = 14.05∙(1.016)x described above for prediction. Thus if we want the y value corresponding to x = 26, using the above model we get ŷ =14.05∙(1.016)26 = 21.35.
We can get the same result using Excel’s GROWTH function, as described below.
Worksheet Functions
Excel Functions: Excel supplies two functions for exponential regression, namely GROWTH and LOGEST.
LOGEST Function
This worksheet function is the exponential counterpart to the linear regression function LINEST described in Testing the Slope of the Regression Line. Once again you need to highlight a 5 × 2 area and enter the array function =LOGEST(R1, R2, TRUE, TRUE), where R1 = the array of observed values for y (not ln y) and R2 is the array of observed values for x, and then press Ctrl-Shft-Enter. LOGEST doesn’t supply any labels, and so you will need to enter these manually.
Essentially LOGEST is simply LINEST using the mapping described above for transforming an exponent model into a linear model. For Example 1 the output for LOGEST(B6:B16, A6:A16, TRUE, TRUE) is as in Figure 4.
Figure 4 – LOGEST output for data in Example 1
GROWTH Function
This worksheet function is the exponential counterpart to the linear regression function TREND described in Method of Least Squares. For R1 = the array containing the y values of the observed data and R2 = the array containing the x values of the observed data, GROWTH(R1, R2, x) = EXP(a) * EXP(b)^x where EXP(a) and EXP(b) are as defined from the LOGEST output described above (or alternatively from the Regression data analysis). E.g., based on the data from Example 1, we have:
GROWTH(B6:B16, A6:A16, 26) = 21.35
which is the same result we obtained earlier using the Regression data analysis tool.
GROWTH can also be used to predict more than one value. In this case, GROWTH(R1, R2, R3) is an array function where R1 and R2 are as described above and R3 is an array of x values. The function returns an array of predicted y values for the x values in R3 based on the model determined by the values in R1 and R2.
Observation: Note that GROWTH(R1, R2, R3) = EXP(TREND(R1, R2, LN(R3)))
Examples Workbook
Click here to download the Excel workbook with the examples described on this webpage.
References
Microsoft Support (2012) LOGEST function
https://support.microsoft.com/en-au/office/logest-function-f27462d8-3657-4030-866b-a272c1d18b4b#:~:text=In%20regression%20analysis%2C%20the%20LOGEST,entered%20as%20an%20array%20formula.
Microsoft Support (2012) GROWTH function
https://support.microsoft.com/en-gb/office/growth-function-541a91dc-3d5e-437d-b156-21324e68b80d


Hi Charles, thank you so much for your time and excellent resources. You have made a tremendous contribution to the ability of researchers. I asked a question yesterday but now I think I have a better way to ask it: I have a multiple regression analysis with several IVs, some of which are coded because they are categorical. There are really only 6 IVs but they become 23 due to the coding. The DV is salary and I am using its natural log. So I believe this is considered log-level regression. Once I have the residuals, leverage, Sresidual, MSE 0.003983), and RMSE (0.063111), how do I calculate how many standard deviations there are between the observed and predicted salary for each employee? I need to convert back to dollars at some point using =EXP but I don’t know where, if at all, to integrate that into the formula. I want to arrive at values that are larger than the Sresidual. For example, one observation has Sresidual 3.88286 and I need to figure out how the SD for this individual is actually 5.30.
Hello Rebecca,
I am not sure that I completely understand what you are trying to do, but it is likely that you can use the delta method to achieve the result that you are looking for. See https://en.wikipedia.org/wiki/Delta_method
Charles
var (r1,r2,rn)=se^2/sqr(r1) * sqr(r2).
the se is the coefficient that minimises the variance.
thanks.
hi,
my name is charles. i suggest that since the regression depends on the homogenuity of variance, we need to consider the variance rn^2 of the standard error that will be
var(r1,r2,rn)=Se^2/sqr(r1)/n sqr(r2)/n. the coefficient of x is that which minimises
the variance r^2.
i hope you consider these.
thanks.
Charles,
Sorry, but I don’t what Se^2/sqr(r1)/n sqr(r2)/n means. Is this the same as Se^2 / (sqr(r1)/n + sqr(r2)/n) ? What are r1 and r2?
Charles
In https://www.real-statistics.com/multiple-regression/residuals/ you claim that least-squares regression relies on homogeneity of variances. However, the logarithmic data transformation breaks this assumption, resulting in a regression that in some cases can badly fail to minimize R^2. How can I get an exponential regression that actually minimizes R^2 (other than by moving from MS Excel to Google Sheets, cf https://techcommunity.microsoft.com/t5/excel/how-do-i-get-an-exponential-regression-that-minimizes-r-2/m-p/1937718)?
Hello Jason,
Exponential regression is often treated as a linear regression model, but the following webpage describes how to treat exponential regression as a non-linear model:
https://www.real-statistics.com/regression/exponential-regression-models/exponential-regression-newtons-method/
Charles
var (r1,r2,rn)=Se^2/(sqr)r1 * (sqr)r2.
the coefficient is that which minimises the variance, that is the least coefficient.
thanks.