Data Analysis Tool
Real Statistics Data Analysis Tool: The two types of independence tests for contingency tables with ordered row an column categories can be performed using the Chi-square Test for Independence data analysis tool.
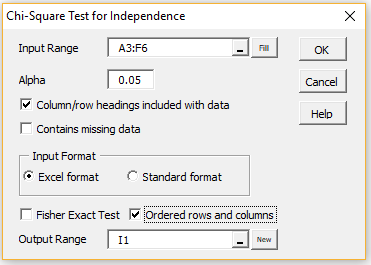
To use this tool for Example 1 of Ordered Independence Testing, press Ctrl-m and select Chi-square Test for Independence from the menu of choices that appears (or from the Misc tab if using the MultiPage interface). Fill in the dialog box that appears as shown in Figure 1, making sure to select the Ordered rows and columns option, and press the OK button.
Figure 1 – Chi-square Test dialog box
The input data range A3:F6 refers to the data on the left side of Figure 2.
Results
The output consists of the normal chi-square test of independence (not shown) plus the results shown on the right side of Figure 2.

Figure 2 – Ordered test results
Note that cell Y3 contains the array formula
=CORREL(Freq2RAW(SelectCols(Anova2Std(A3:F6),”1,3″)), Freq2RAW(SelectCols(Anova2Std(A3:F6),”2,3″)))
Cell Y4 contains the formula =SUM(B4:F6), cell Y5 contains =(Y4-1)*Y3^2 and cell Y6 contains =CHISQ.DIST.RT(Y5,1).
Range AB3:AB4 contains the array formula
=KCORREL(Freq2RAW(SelectCols(Anova2Std(Sheet4!A3:F6),”1,3″)), Freq2RAW(SelectCols(Anova2Std(Sheet4!A3:F6),”2,3″)),TRUE)
Finally, cell AB5 contains =AB3/AB4 and cell AB6 contains
=2*NORM.S.DIST(-ABS(AB5),TRUE)
Examples Workbook
Click here to download the Excel workbook with the examples described on this webpage.
References
Howell, D. C. (2001) Chi-square with ordinal data
https://www.uvm.edu/~statdhtx/StatPages/More_Stuff/OrdinalChisq/OrdinalChiSq.html
Agresti, A. (1996) An introduction to categorical data analysis. New York: Wiley.
