We review three different measures of effect size for the chi-square goodness-of-fit and independence tests, namely Phi φ, Cramer’s V, and the Odds Ratio. We also describe the effect size for Fisher’s exact test.
Phi φ
For a 2 × 2 contingency table, phi is the commonly used measure of effect size, and is defined by

where n = the number of observations. A value of .1 is considered a small effect, .3 a medium effect, and .5 a large effect.
Phi is equivalent to the correlation coefficient r, as described in Correlation. Phi is the measure of effect size that is used in power calculations even for contingency tables that are not 2 × 2 (see Power of Chi-square Tests). Commonly phi is denoted w when used in this way.
Cramer’s V
Cramer’s V is an extension of the phi effect size for non 2 × 2 contingency tables, and is calculated as

where df* = min(r – 1, c – 1) and r = the number of rows and c = the number of columns in the contingency table.
The guidelines (Cohen) are the same as for the equivalent phi value; i.e. V√df* = .1 represents a small effect, = .3 represents a medium effect and = .5 represents a large effect. These guidelines are equivalent to those shown in Figure 1.
| df* | small | medium | large |
| 1 | .10 | .30 | .50 |
| 2 | .07 | .21 | .35 |
| 3 | .06 | .17 | .29 |
| 4 | .05 | .15 | .25 |
| 5 | .04 | .13 | .22 |
Figure 1 – Effect sizes for Cramer’s V
As we saw in Figure 4 of Independence Testing, Cramer’s V for Example 1 of Independence Testing is .21 (with df* = 2), which should be viewed as a medium effect.
Odds Ratio
For a 2 × 2 contingency table, we can also use the odds ratio measure of effect size as described in the following example.
Example 1: Calculate the odds ratio for the data in Example 2 of Independence Testing.
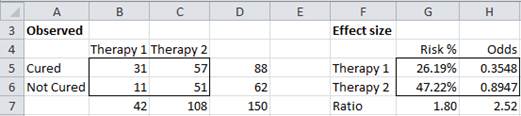
Figure 2 – Odds ratio effect size
As we saw in Example 2 of Independence Testing, there is a significant difference between those taking therapy 1 and those taking therapy 2. In fact, 11/42 = 26.19% of the people who took therapy 1 were not cured, while 51/108 = 47.22% of those who took therapy 2 were not cured. This shows that those taking therapy 2 are .4722/.2619 = 1.80 times as likely as those taking therapy 1 to remain uncured. This is a meaningful measure of effect size, called the risk ratio or relative risk.
A related measure of effect size is the odds ratio. The odds of a person who took therapy 1 remaining uncured is 11 to 31 or .3548. The odds of a person who took therapy 2 is 51 to 57 or .8947. This means that the odds of remaining uncured is .8947/.3548 = 2.52 times greater for therapy 2 than for therapy 1. The ratio 2.52 is the odds ratio.
According to Chinn, S. (2000), the odds ratio can be reinterpreted as a Cohen’s d effect size by using the formula
![]()
Here 1.81 is π/√3 to two decimal places.
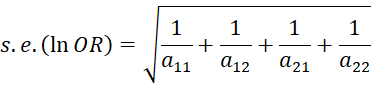
Observation: For a 2 × 2 contingency table with entries the standard error of the natural log of the odds ratio is
Thus, an estimate of the 1 – α confidence interval is
![]()
where zcrit = NORM.S.INV(1-α/2).
The 95% confidence interval for the odds ratio of 2.52 in Example 1 is (1.15, 5.53), as shown in Figure 3.
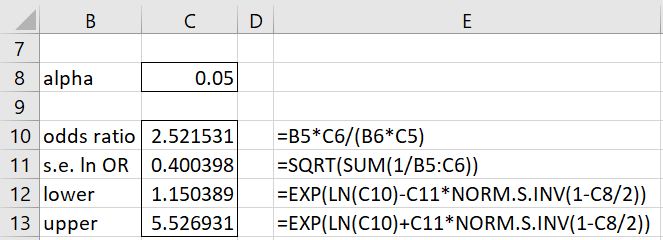
Figure 3 – 95% confidence interval for odds ratio
Worksheet Functions
Real Statistics Function: The following function is provided in the Real Statistics Resource Pack:
ODDS_RATIO(R1, lab, alpha): returns a column array with the odds ratio for the 2 × 2 contingency table in R1, s.e. for ln OR and the lower and upper limits of the 1-alpha confidence interval.
If lab = TRUE, then an extra column of labels is appended to the result (default FALSE); the default for alpha is .05.
The array formula =ODDS_RATIO(B5:C6,TRUE) returns the results shown in range B10:C13 of Figure 3.
Fisher Exact Test
The three effect size measures described above can also be used for Fisher’s Exact test. This is straightforward for the odds ratio. For the other two effect size measurements, an approximate chi-square statistic is calculated from the p-value of Fisher’s exact test using the CHISQ.INV function, from which the phi and Cramer’s V effect sizes can be calculated as described above. Alternatively, you can use the following Real Statistics array function.
Real Statistics Function: The following array function is provided in the Real Statistics Resource Pack:
FISHER_TEST(R1, lab): returns a column array containing the following values: p-value for the two-tailed Fisher’s exact test, sample size, df, chi-square statistic, Cramer’s V, and phi (labeled w). If lab = TRUE (default FALSE), then an extra column of labels is appended to the output.
You can use FISHER_TEST wherever the FISHERTEST function is used. E.g. the output from the array formula =FISHER_TEST(U4:V6,TRUE) is shown in range X2:Y7 of Figure 4.
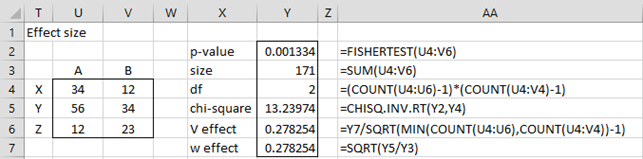
Figure 4 – Effect sizes for Fisher’s exact test
Column AA shows how to calculate each cell in column Y separately.
The FISHER_TEST function is subject to the same limits on the total cell count as FISHERTEST. A third argument can be added to FISHER_TEST to override this limit in exactly the same manner for FISHERTEST (see Fisher Exact Test).
Examples Workbook
Click here to download the Excel workbook with the examples described on this webpage.
References
Select Statistical Services (2020) Odds ratio – confidence interval
https://select-statistics.co.uk/calculators/confidence-interval-calculator-odds-ratio/
Chinn, S. (2000) A simple method for converting an odds ratio to effect size for use in meta-analysis
http://www.aliquote.org/pub/odds_meta
Cohen, J. (1988) Statistical power and analysis for the behavioral sciences. 2nd ed. Lawrence Erlbaum Associates; p79-80.
https://utstat.utoronto.ca/~brunner/oldclass/378f16/readings/CohenPower.pdf
Kim, H-Y (2017) Statistical notes for clinical researchers: Chi-squared test and Fisher’s exact test
https://doi.org/10.5395/rde.2017.42.2.152
Dear Charles,
Is it correct to calculate the 95% confidence interval for relative risk in the same way as for the odds ratio?
Best wishes,
Fernanda.
Hello Fernanda,
It is similar. See
https://sphweb.bumc.bu.edu/otlt/mph-modules/bs/bs704_confidence_intervals/bs704_confidence_intervals8.html#:~:text=Note%20that%20the%20null%20value,groups%20are%20statistically%20significantly%20different.
Charles
Thanks a lot for your attention.
do you have a reference for the table for interpretation of Cramer’s V?
The table is equivalent to V√df* = .1 represents a small effect, = .3 represents a medium effect and = .5 represents a large effect. You can find this in almost any source about Cohen’s effect size. The following is a reference with the table:
https://stats.stackexchange.com/questions/567003/small-medium-large-cram%C3%A9rs-v-effect-size-tables-available-for-degrees-of-freedo
Charles
Hi Charles,
this is very helpful. I am trying to do a meta-analysis with the effect sizes from chi-square-tests. Do you know, if its possible to compute confidence intervals with these effect-sizes?
Best regards
Jil
Hello Jil,
Since the effect size is based on the correlation coefficient, you can use the confidence interval for the correlation coefficient. These can be calculated as described at
https://www.real-statistics.com/correlation/one-sample-hypothesis-testing-correlation/
Charles
Dear charles, how can we consider the phi coefficient value of 1.04, with a chi-square value of 2044.255 with a sample size of 1945? Is there any alternative way to calculate the effect size for this?
Hello Vinu,
1. As described at https://www.real-statistics.com/correlation/dichotomous-variables-t-test/ phi of 1.04 would be considered a large effect.
2. As stated in the first sentence of this webpage, Cramer’s V and odds ratio are alternative measures of effect size.
Charles
Hi Charles,
Could you please help to confirm this result for me? To be honest, I am not confident with statistics.
n1 = 91, total population = 259
n2 = 56, total population = 115
I followed you and here are the results: Chi-square = X2 (1) = 6.139, p = 0.01322321, φ = √(X2 / n) = 0.2043572968
Thank you so much,
Thuy
Hi Thuy Nguyen,
If you email me an Excel spreadsheet with your calculations, I can check to see whether you have done things correctly.
Charles
Hi again,
My calculations as follows:
51 117 168
14 45 59
65 162 227
X2(1)=0.9388, p=0.3, phi=φ = √(X2 / n) =0.06
Can you help to confirm this result, please?
Thank you very much!
Thuy
Looks right.
Charles
Dear Mr. Zaointz,
Thank you for this article! This is one of the few articles on the internet which contains a table with multiple degrees of freedom for Cramérs V. I’m curious to where you found this table, you mention it’s from Cohen.
I’ve found a copy of his book, Statistical Power Analysis for the Behavioural Sciences. However, I can’t seem to find this table in his book. Is there somewhere I can find this table or did you make the table yourself based on calculations?
I’m looking forward to your reply!
Best regards,
Jeroen
Jeroen,
The guidelines (Cohen) are the same as for the equivalent phi value; i.e. V times the square root of df* = .1 represents a small effect, = .3 represents a medium effect and = .5 represents a large effect.
I have just clarified this on the website. Thank you for your question.
Charles
Thanks Charles,
This helped me a lot.
Bests,
Evie
Hi Charles,
I am doing a chi-square test for independence with df 21, and I’m not sure how to calculate the Cramer’s V effect size since it’s >5. Is there a way to do this? Any help would be much appreciated,
Thanks!
Hi Martha,
As stated on the webpage, a small effect is phi = .10, a medium effect is phi = .30 and a large effect is phi = .50. These values change for df* > 1. To get the appropriate value divide these three values by the square root of df*. Thus for df* = 9, the guidelines for small, median and large become .10/3, .10 and .50/3.
Charles
Hi Charles,
I hope you are well!
Thank you so much for this article and explaining how to work out Cohen’s d when df>5. I was wondering if you mentioned this in any of your academic articles, or know of an academic article I can use to cite this for my college paper?
Thanks!
Cindy
Cindy,
I got this interpretation from two sources, but I don’t have the time to find them now (I should have written this down on the webpage as I have started to do more recently. In any case, the following webpage may be helpful:
https://www.researchgate.net/post/How-can-I-intepret-the-effect-sizes-of-Cramers-V-when-DF-3
Charles
Hey,
I have a problem with the function: FISHER_TEST(R1, lab). When I execute the function FISHER_TEST(B4:C6,”TRUE”) as in your example. It only gives me the p-value and not all the other elements: sample size, Cramers V, phi coefficient….
Can you maybe help me?
Hello Julie,
FISHER_TEST is an array function and so you can’t simply press Enter. See the following webpage for how to use array functions:
Array Formulas and Functions.
Charles
Thanks.
And how do you know if the phi coefficient is positive or negative with a 3×3 or 3×2 contingency table?
Julie,
The phi value will always be non-negative. If you could tell that the value is positive or negative, how would you use this information?
Charles
Hi Charles,
This is very helpful, thank you for this website! I’m writing an academic paper, and am wondering if you have a formal citation for Cramer’s V that you would suggest using?
Sarah
🙂
Hi Sarah,
Cramer’s V is described in many sources, in particular Howell’s textbook (see Bibliography).
Charles
Charles,
I have several things to bring your attention regarding the current “Chi-square Test for Independence” algorithm and analysis results rendered by the FISHER_TEST(R, lab) function.
To explain the issues I found, let me use the example in Figure 3 of this section.
1) Output generated by Chi-square Test for Independence – Cramer’s V values for Pearson’s and Maximum Likelihood test
If the formula for the Cramer’s V provided in this section is accurate, the effect should be 0.1986 for the Pearson’s test. This value came from the squared value of {Pearson’s chi-square statistic (13.491) divided by [the sample size (171) *df (2)]}. The values listed under the column of Cramer’s V equal to the Phi effect, instead, for both Pearson’s and Maximum likelihood tests.
2) FISHER_EXACT(R, lab) – incorrect values for the chi-square statistic and Cramer’s V effect
2.1) Chi-square statistic
The chi-square statistic value is not rendering an accurate result. I compared against the output generated by Real Stat Analysis Tool (ie, Chi-square test for independence) and calculated values using various function s(eg, CHI_STAT) and mathematical calculations from scratch. The accurate chi-square statistic should be 13.491 (I rounded up for the sake of easier review).
2.2) V effect
The formula to obtain the Cramer’s effect should have incorporated the degrees of freedom in the denominator. Currently, the Phi effect is being provided in the V effect.
2.3) W effect (ie, Phi effect)
The formula is accurate. But because the chi-square statistic (ie, input value) is not accurate, this value is not accurate either.
As you stated in this section, the W effect is not the same as the V effect. But, the rendered values for these effects are the same in Figure 3, which indicate something is not right.
As always, I enjoy the website. I will be happy to help the contents to be as accurate as you intended for users.
Thanks,
-Sun
Sun,
I don’t see how you calculated the chi-square value to be 13.491. I calculated it from scratch as well as using the Real Statistics functions and got the value 15.8181 each time.
I also don’t see where you got the value of 171 for the sample size. The sample size should be 175.
Finally the reason why Cramer’s V and Cohen’s w yield the same value is that the minimum of the # of rows and columns is 2 (the columns), and so the correction for V is 2 – 1 = 1. This means that V = w in this case.
Charles
Hi
In Mcnemar test, what is the formula for effect size (Odds ratio?)
Luiss,
Perhaps the following links may be helpful:
https://www.researchgate.net/post/Is_it_possible_to_calculate_effect_size_value_for_data_from_a_chi-square_distribution_with_repeated_measures_design
https://stats.stackexchange.com/questions/279347/mcnemar-test-reporting-chi-square
Charles
Hi Charles,
I am investigating independence of a small sample size using Fisher’s exact test. I also want to determine the extent of the dependence using Cramer’s V. Is it possible to calculate Cramer’s V using the result from the exact Fisher test (as the V normally uses the Chi Square value which in this case cannot be calculated correctly).
Cheers,
Luke
Luke,
Yes, I believe so. This is what I have done in the FISHER_TEST, described towards the bottom of the webpage.
Charles
Thanks Charles, I appreciate it!
Hi Charles,
I am currently working to identify if there any differences between male and female in their responses to 5 likert scale.
Can I /should I use Cramer’s?
Could you please help me with the refernce for Figure 1 – Effect sizes for Cramer’s V?
Thanks in advance,
Ibrahim,
Hi Ibrahum,
Without more information, I am not able to answer your first question. Cramer’s V is a commonly used effect size for the chi-square test of independence.
I believe that the reference for the table in Figure 1 can be found in the book by Cohen that you can find in the Bibliography. I also found the following reference: https://www.researchgate.net/post/How_can_I_intepret_the_effect_sizes_of_Cramers_V_when_DF_3
Charles
perhaps im wrong, but i think phi/cramer are power tests for nominal by nominal data and eta is for nominal by interval..?
Paul,
Sorry, but I don’t understand what you mean by “power tests”
Charles
sorry, i meant effect size as a test of statistical power..
Paul,
Sorry, but I don’t know what this means either. The effect size is used in measuring statistical power, but it is not a test of statistical power.
How do you define eta in the case of contingency tables?
Charles
Charles,
how can I do a power-analysis for my X^2 Test with Cramer’s V? The program G-power for example only supports the power analysis with cohens w(omega) and not with Cramer’s V?
Thanks very much in advance,
Sara from Switzerland 😉
Sorry Sara, but I only know how to do this.
Charles
I was wondering if I need to calculate an effect size if my chi square was not statistically significant? I.e. the p value was larger than .05
Thanks!
Emma,
You can calculate the effect size even when the result is not statistically significant, and in fact this is often desirable.
Charles
Hai Charles
I need your explanation about how to interpret of phi coefficient result?
Please give the literature that I can believe
Phi is just the correlation coefficient. On interpretation is that r = .1 is a small effect, r = .3 is a medium effect and r = .5 is a large effect.
See https://real-statistics.com/regression/linear-regression-models-for-comparing-means/
You can find this interpretation from many sources. See also https://en.wikipedia.org/wiki/Effect_size
Charles
Hi Charles,
Please forgive the silly question but what is a 2 x 2 table?
I am currently working on an assignment that looks to analyse the association of gender and university subject enrollment.
In the table, there is male and female at the top, and on the side there is about 20 different subject courses…does this qualify as 2×2 even though it is quite long?
Can I /should I use Cramer’s?
any advice would be greatly appreciated!
Thanks in advance,
Abiola
Abiola,
This would be a 2 x 20 contingency table. You can use Cramer’s V.
Charles
Dear Charles,
I’m wondering are the values in the table for the interpretation lower bounds, upper bounds or midpoints?
Peter
Peter,
Which table are you referring to?
Charles
Sorry, meant Figure: Figure 1 – Effect sizes for Cramer’s V
My guess would be that it is:
0.10 < 0.30 = small, 0.30 < 0.50 = medium, 0.50 or more = strong.
Peter,
Figure 1 presents this type of interpretation of Cramer’s V.The actual thresholds for small, medium and large depend on the value of df*
Charles
Hi Charles,
Thanks for this great website! I have a question about Cramer’s V effect sizes for dfs larger than 5 (where the table you posted above ends) in Chi-tests. I’m working with a large number of conditions, so I sometimes have 2×5 up to 4×7 Chi-square tables, which give me dfs of 9 to 18 in some cases. Should I interpret small Cramer’s V (i.e. p=0.0000, Cramer’s V=0.097, df=9) as moderately to large effect size in cases with a large df? Or is this test not advisable for so many conditions? Thank you!
As stated on the referenced webpage, “Per Cohen, you use the guidelines for phi divided by the square root of df*”. This handles even large contingency tables, including 4 x 7 tables. Whether Cohen’s guidelines are correct, I cannot say.
Charles
Hi Charles,
Appreciate the post and your simplification of the content in Cohen.
Something bothers me about the rules of thumb for Phi and Cramer’s V in that there is no new information in the guidelines for Cramer’s V. So why not just use Phi for any size table and the 0.1, 0.3, 0.5 interpretation?
Am I missing something here?
To clarify what I mean by “no new information”:
Cramer’s V = Phi / sqrt(df*)
Rule-of-thumb ROT Cramer’s V = ROT Phi / sqrt(df*)
David,
The new information is the fact that the rule of thumb for Cramer’s V handles more than just 2 x 2 contingency tables.
Charles
David,
The rule for Cramer’s V is an extension of the rule for phi. In fact the rule for Cramer’s V is the same as for phi in the case of a 2 x 2 table.
Charles
Thanks!
Thanks again for taking the time to answer my query. Sorry to come back to this, but now I realize what is bothering me.
Isn’t Cohen defeating the purpose of Cramer’s V by adjusting his Rules-of-thumb for df*?
By way of analogy, it strikes me that this is kind of like doing a Bonferroni adjustment to a p-value, and then doing the same adjustment to your alpha value, thus cancelling out the benefit of Bonferroni.
David,
Sorry, but I don’t see how your analogy applies in this situation.
Charles
Ok, please skip the analogy.
What I am saying is that Cohen’s ROT “Small” = 0.1; “Medium” = 0.3; “Large” = 0.5 should be applied to Cramer’s V without modification.
Hi Charles,
I would much appreciate it, if you could answer e this question. I am doing goodness-of-fit test in SPSS and it’s only related to one nominal variable – I want to see whether two distributions are statistically different or not. The test shows p-value > 0.05 which means that the distributions are not statistically different. However, I need to calculate power and effect size of the chi-square test. Can you explain me how I can do this? I was thinking to calculate power in RStudio, but I need effect size and that is my problem – I don’t know how to get this value.
Thank you in advance!
Olivera,
Sorry, but I don’t use SPSS.
The Real Statistics website shows how to do this in Excel.
Charles
Hi Charles,
Could you explain why Cramer’s V = 0 means there is no association at all? I am confused. When all of expected frequencies match observed frequencies, X^2 equals zero and so does Cramer’s V, right? In this case, is it considered there is “perfect association”?
CL
CL,
Yes, you are correct that chi-sq = 0 means that V = 0, but this does not mean that there is no association.
Charles
I’m studing the number of male anf female authors in a scientific field. Data are 35776 men and 17575 women. Chi-square test between real data and expected data according with the null hypothesis (no gender difference: 26675.5 men; 26675.5 women) obviously is clearly significant p<.000001.
My question is: it makes sense to calculate effect size when only a variable (gender) is at stake?.
Thanks in advance.
Julio,
Even when there is only one variable, it makes sense to look at the effect size. Especially when you have a very large sample, you might detect a significant effect, but this doesn’t mean that the effect is very big. The effect size measurement helps you determine whether or not the effect is small or large or somewhere in between.
Charles
Many thanks, Charles.
In that case, I assume that Phi or Cramer’s V measures also are appropiate (although I have not a 2 x 2 contigency table). Is that right?
Julio
Yes
Dear Charles,
and what about if I compare sample and population values of a categorical level of education variable?
What would be the appropriate effect size measure? Many thanks!
Dirk
Dirk,
Sorry, but I don’t understand the situation that you are describing. Please fill in some of the details.
Charles
Sorry about that.
I meant when the variable you are comparing between the sample and population has >2 categories.
For example education (low/medium/high). I am guessing then you will simply use Cramer’s V as an indication of the effect size of the differences between the sample and the population.
Is this correct?
Dirk,
Yes, when your contingency table is larger than 2 x 2, you can use Cramer’s V as the effect size (actually you can also use it for a 2 x 2 table as well).
Charles
Hi Charles,
I apologize if this is a bit obvious, but what does the X2 refer to in Cramer’s V?
Thank you
Nevermind, I now understand it’s the Pearson’s Test Statistic.
Hi Charles,
I was wondering if you are able to comment on the following scenario. If you are using Fisher’s exact test for cases were cells are n < 5 (despite having an overall large sample size, n= 1000), would it not make sense to obtain Cramer's Phi or V since these values depend on the chi-square value (which may be an inaccurate estimation due to the small sample size)? Thank you!
Megan,
Yes, I would use the same measure for effect size.
Charles
Thanks Charles for your reply! So to be clear, since Fisher’s exact test only provides a p value, you would not provide the effect size (in Stata, it is possible to obtain fisher’s exact test with the effect size e.g., tab var1 var2, exact V, which makes things a bit confusing!).
You can use the odds ratio as a measure of effect size for Fisher Exact Test.
Charles
Can a Cramer’s V coefficient be larger than 1?
Hector,
Yes, Cramer V is always less than 1. See people.vcu.edu.
Charles
Thanks, Charles! I just found out that I was not calculating it correctly.
I note that in the table for Cramer’s V you show lower values
for V as being a medium or large effect when the DF = 3 rather than
2 or 1.
I recently did a chi test on 2 samples and 31 variables with 30DF.
With X2 at 259.734 the p value was extremely low, but V came in at
0.13, and I calculated w also as 0.13. Yesterday I thought these rather
low values, but I now wonder if, with 30DF, the effect value might be
considered larger than I thought at first. Is this right? Does the
rating of V and w rise with yet more DF than 3 ?
David,
It probably does, but I have never found any values after df = 3.
Charles
Hi Charles,
What is the best (most simple, robust) test statistic to measure the correlation between multiple (>2) binomial variables?
And how does the sample distribution for this test statistic depend on the number of variables k, frequency per variable f, and sample size n, under the null hapothesis (no correlation)?
Dear Charles,
I am doing a meta-analysis among 10 groups using the chi square test. Statistical significance is tested (p<0.05). However, effect size is very small as Cramer's V equals 0.024. I am aware that statistical meaningfulness may come up because of the large sample size. So I am wondering how to correctly interpret this result. Can I say that two categorical variables barely have no relation to each other? Thanks a lot.
Best,
Stacey
Stacey,
It sounds like you understand the situation very well. I would simply report that there is a significant result (probably due to a large sample), although the effect is very small, i.e. the association between the variables is very small.
Charles
Thank you Charles. That’s a fair report. Now I have a better idea of how to report this result. Thanks a lot!
please I want to ask, phi, Cramers and correlation coefficient are they the same?
Dominic,
Phi is equivalent to the correlation coefficient in the case of 2×2 contingency tables. Cramer’s V is an extension of phi for larger contingency tables, but is not equivalent to the correlation coefficient.
Charles
Charles,
Can you also help me with understanding how to calculate Confidence Intervals for Cramer’s V? I have looked at several resources and they either don’t answer the question or provide an equation that I do not understand.
Thank you in advance!
Tiffany
Tiffany,
I have not tried to address this issue yet. Here are two references that might be helpful to you.
https://books.google.it/books?id=nlBaBQAAQBAJ&pg=PA40&lpg=PA40&dq=confidence+interval+cramer%27s+v&source=bl&ots=ZVyj_QjGkP&sig=rVDV2HYLu-kpiQqtMEAgkVxj0DI&hl=en&sa=X&ved=0ahUKEwjfjeuIw4fOAhWpBcAKHUFsD9oQ6AEIHDAA
http://www.statalist.org/forums/forum/general-stata-discussion/general/1348226-how-to-display-confidence-intervals-around-kramer-s-v
Charles
i want prove that Chi square test is greater than the G test with CONSTANT (i.e X2=G+k) please someone should help via Muhammedbello31@yahoo.com.
Thanks
Muhammed,
I believe that the G test is generally more accurate, although usually the results are not very different.
Charles
Hello Charles,
I want to examine the relationship between two categorical variables (2×2 table). From my reading I know the the Chi-Squared test will measure if there is an association, while the effect size Phi will show the strength of this association. But I have also read that Phi can be used as a correlation coefficient. What is the difference in Phi as an effect size and Phi as a correlation coefficient? They seem to be the same statistic but reported differently. I’m tying myself into knots trying to decide which one to report – chi-square with phi as an effect size or phi correlation coefficient – it seems rather tedious to report (and read) multiple chi-square tests to measure the one categorical variable’s relationship with multiple other categorical variables. Any suggestions would be appreciated. Thank you!
Alannah,
If you are conducting a chi-square test of independence, then just report phi as an effect size measurement.
Regarding measuring “one categorical variable’s relationship with multiple other categorical variables”, I would need to see more details about the situation before commenting further. One technique that may be useful is log-linear regression as described on the webpage
Log-linear regression.
Charles
Dear Charles,
If I want to see if 2 nominal categories are related and how much, I understood that I have to use the chi-square test. But, I am finding the problem of expected under 5 in some cells (the tables are larger than 2×2). My question is: I only can reed the value of Cramers’V if I could have calculate the chi-square properly?
Dear Janaina,
If the values are not too large, you should use Fisher’s Exact Test. You can use the odds ratio as an estimate of effect size.
Charles
How do I calculate effect size for the McNemar test? Is Cramer’s V still appropriate?
It is best to use the odds ratio.
According to the following website, you can covert this to a Cohen’s d via the formula LN(OR)/1.81.
Chinn S: A simple method for converting an odds ration to effect size for use in meta-analysis. Statistics in Medicine 2000, 19:3127-3131)
http://www.aliquote.org/pub/odds_meta.pdf
Charles
Dear Sir,
thank you for this nice post! Very helpful.
I have a question regarding applying the Cramer’s phi to a Chi-square Goodness of fit test (I saw in a previous reply that you already suggested a solution, but I would like to be sure that it can also be applied to my case).
I’m investigating whether the number of individuals possessing a specific allele at a given loci match a theoretical distribution. I therefore have something like this:
Allele Observed Expected Probabilities
A 1 0.05312500
B 9 0.12500000
C 17 0.40657437
D 0 0.00208375
E 19 0.28958125
F 0 0.00208375
G 4 0.01681000
H 0 0.10265813
I 0 0.00208375
I have N=60 and 9 alleles. I know that probabilities are very low and X-square might be innacurate, but I just would like to know whether a Cramer phi could be applied.
So…if I run a chi-square test for given probabilities on this data set I get:
X2=178.0666
p.value=<2.20E-16
df=8
Is the Cramer phi calculated as the square-root of (178.0666/60) ? If so, in that case I get a value of 1.722724, which is outside of the range for the phi. Is it because the size of the table is too large? Or am I doing something wrong?
In case Cramer phi is not applicable in my case, I would appreciate if you could suggest an effect size equivalent for this data. I even tried Pearson correlation (correlating the vector of observed and a vector of expected frequencies) to have a measure of association, but I'm quite sure that this is not the right approach to follow.
Thanks in advance!
Dear Luigi,
Before we look at Cramer’s phi, let’s review the calculation of the chi-square statistic. This statistic is calculated using the observed and expected values — not the expected probabilities. Since there are 50 observations, N = 50 (and not 60 as you have written). Thus, to get the expected values you need to multiply each of the probabilities by 50. This will produce the following table:
Allele Obs Exp
A 1 2.65625
B 9 6.25
C 17 20.3287185
D 0 0.1041875
E 19 14.4790625
F 0 0.1041875
G 4 0.8405
H 0 5.1329065
I 0 0.1041875
50
From this I calculate a chi-square value of 9.66. One big problem, however, many of the expected values are less than 5, which violates an assumption for using the chi-square test.
Charles
Dear Charles,
Thanks for your reply. I actually made a mistake in copying/pasting the data. In fact, allele “G” was not 4 but 14 (hence, N=60). Beside this mistake, I agree that there are too many expected values less than 5 and, thus, I cannot apply a Chi-square test. Do you know any alternative that I could use in my specific case? I would prefer to retain the low expected values, because in may case they agree with the “0” counts that I have at the observed values and are indeed a sign of “good fitting”
If you cannot combine categories so that the expected values are at least 5, then you could use an exact test. How this works for a 2 x 2 contingency table is explained on the webpage Fisher Exact Test.
In your case, you don’t have a 2 x 2 contingency table, but the approach is similar, except that you probably need to test using the multinomial distribution (instead of the binomial distribution).
Charles
Thanks a lot for your quick reply! I have already tried the exact multinomial test, but I couldn’t find a way to calculate an effect size similar to a Cramer V. Do you know if there is a way to calculate it?
Sorry Luigi, I don’t know how to calculate an effect size in this case.
Charles
Dear Sir,
As a biologist, I am testing the influence of genetic component in caste determination in a desert ant. In my study species, colonies contain small workers and large workers, and I am testing whether the fate of developing larvae (into a small or a large adult worker) has a genetic component. Colonies are headed by a single mother, that is multiple mated. I have genotyped small and large workers from several colonies, determined their patriline, and compared patriline representation between the two castes using G-tests for heterogeneity (e.g., each colony has two columns (small and large workers) and x rows, with x corresponding to the number of queen’s mates, i.e. from 6 to 13). My results reveal a genetic effect in some colonies, but not in others.
I would like to perform a power analysis of the G-tests. I have used G*Power (3.1.9) to compute effect sizes and power tests for each colony. But G*Power gives non credible results.
Thus, I have two questions:
1. Are Cohens’w or Cramers’V suitable for testing effect size on G-tests for heterogeneity?
2. When computing Cohens’w, I obtain values of effect size > 8 and power = 1. This sounds also weird.
Maybe do you have some suggestions to help me deciphering this puzzle?
Warm thanks in advance for your reply.
Serge
Serge,
According to the handbook of Biological Statistics (http://www.biostathandbook.com/gtestgof.html) the power analysis for the chi-square test can be sued for the G-test. Thus you should be able to use G*Power to compute effect size and power (you could also use the Real Statistics Statistical Power and Sample Size data analysis tool). I don’t know why you are not getting credible results.
For more information about the G-test (aka the maximum likelihood test for independence), see https://real-statistics.com/chi-square-and-f-distributions/independence-testing/.
Charles
Hello,
another question from me 🙂 If we have a Cramer’s V of 0.2, would it be small or moderate?
Thank you!
Hana,
The commonly used values are that .1 is small, .3 is medium and .5 is large.
Charles
Hi Charles
Can you give me the exact reference of this used values? I can’t find the Literatur…
Thanks a lot,
best regards!
Debbie,
These are all commonly used measures of effect size. Which one do you need the literature reference for?
Charles
Dear Charles,
thank you for this very helpful website. Is it also possible to use Cramer’s V for one-dimensional (Goodness-of-Fit) Chi-square tests, for example if I am testing in a 1 x 4 table whether the cases are evenly distributed across all four categories? If it is possible to calculate V, would i calculate it with df = 3? Or df =1? (since df = 0 would not work?). If Cramer’s V is not the typical approach for this type of Chi-square test, do you have any other suggestion?
Thank you very much in advance for your input,
Sue
Sue,
The effect size used in this case is phi (also called w) as described on the referenced webpage. w = sqrt(Chi-sq/n)
Charles
Dear Charles,
I know this question was long ago, but my questions fits in this topic. At the beginning you mention φ=r. And after that you say that w is used as φ in situations with no 2×2 tables (eg. like in my situation: 1 Group Yes/No).
Is then w=r also true in this case? Or is this only if i calculate a “normal” 2×2φ?
Greetings from Austria
Markus
Markus,
First you have to tell me what definition you are using for the correlation coefficient r. In the 2×2 case this is clear, but it is not so clear in say the 3 x 3 case.
Charles
could you help me with this?
I am going to calculate the power for chi-squared test in 2*3 contigency table.
We expect the conditional distributions to be approximately (.2,.2,.6) and (.3 , .3 , .4).
with 100 observations for each treatment and p(type I error)=0.05, what is the approximate power to compare the distributions?
Thanks in advance,
Mary
Maryam,
Assuming that n = 100 and the observations are (20,20,60) and (30,30,40), then in a chi-square test of independence chi-square = 8 and so the effect size w = sqrt(8/100) = .282843 and df = (2-1)(3-1) = 2. Using the Real Statistics’s Power and Sample Size data analysis tool, the approximate power is 71.76% (provided I didn’t make a mistake along the way).
Charles
Cheers, this was super helpful, saved a bunch of us after our education system failed to tell us what all the letters actually meant!
A few questions.
On Cramer’s V….what about df = 4?
And, what is the citation for Cohen there?
I don’t have any information regarding interpretation of Cramer’s V for values of df* > 3, The citation is given on the referenced webpage, namely [Lo/GW]. You can find these listed in the Bibliography webpage.
Charles
Joseph,
I now have a better answer for you. I have just updated the webpage with this information.
Charles
This was so helpful thank you!
I was just wondering if you might distinguish further between the Chi goodness of fit test and the Chi test for independence:
Is it valid to calculate both Cramer’s V and the Odds Ratio for each of these tests?
What would the Odds Ratio tell us if applied to a goodness of fit test?
Kay,
I have not used Cramer’s V with goodness of fit, only independence testing. I have seen the following statement on Wikepedia, but I can’t comment further on it.
“Cramér’s V may also be applied to goodness of fit chi-squared models when there is a 1×k table (e.g.: r=1). In this case k is taken as the number of optional outcomes and it functions as a measure of tendency towards a single outcome.”
Regarding the odds ratio, I don’t know how this could be done since you would need a 2 x 2 comparison.
Charles