Basic Concepts
The Friedman test is a non-parametric alternative to ANOVA with repeated measures. No normality assumption is required. The test is similar to the Kruskal-Wallis Test. We will use the terminology from Kruskal-Wallis Test and Two Factor ANOVA without Replication.
Property 1: Define the test statistic
![]()
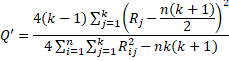
where k = the number of groups (treatments), n = the number of subjects, and Rj is the sum of the ranks for the jth group. If the null hypothesis is that the sum of the ranks of the groups is the same, then
![]()
when k ≥ 5 or n > 15. The null hypothesis is rejected when Q > 
Example
Example 1: A winery wanted to find out whether people preferred red, white, or rosé wines. They invited 12 people to taste one red, one white and one rosé wine with the order of tasting chosen at random and a suitable interval between tastings. Each person was asked to evaluate each wine with the scores tabulated in the table on the left side of Figure 1.

Figure 1 – Friedman’s test for Example 1
The ranks of the scores for each person were then calculated, and the Friedman statistic Q was calculated to be 1.79 using the above formula. Since p-value = CHISQ.TEST(1.79, 2) = 0.408 > .05 = α; we conclude there is no significant difference between the three types of wines.
Alternative Definition 1
Just as for the Kruskal-Wallis test, an alternative expression for Q is given by
![]()
where 
For Example 1, we can obtain

Figure 2 – Alternative way of calculating Friedman’s statistic
Alternative Definition 2
An alternative definition for Q is
![]()
When ties in any column are present, the following adjusted form can be used
Here, Rij is the rank of the ith element (row) in the jth group (column).
Finally, there is the following alternative test, based on the F distribution, which is more accurate
![]()
Worksheet Functions
Real Statistics Functions: The Real Statistics Resource Pack contains the following functions:
FRIEDMAN(R1, ties, chi) = value of Q on the data (without headings) contained in range R1 (organized by columns).
FrTEST(R1, ties, chi) = p-value of Friedman’s test on the data (without headings) contained in range R1 (organized by columns).
If ties = TRUE (default FALSE), then the ties-corrected form is used, while if chi = TRUE (default) then the chi-square test form is used, while if chi = FALSE then the F test form is used.
For Example 1, FRIEDMAN(B5:D14) = 1.79 and FrTEST(B5:D14) = .408.
Observations
There is no commonly accepted measure of effect size, although Kendall’s W is often used (see Kendall’s Coefficient of Concordance). Note that Kendall’s W can be calculated from Friedman’s Q as follows:
![]()
Also used is the r coefficient for Kendall’s W, which is
![]()
In fact, it can be shown that r is the average (Spearman) correlation coefficient computed on the ranks of all pairs of raters.
See the following webpages for more information about Friedman’s test:
Links
↑ ANOVA with repeated measures
Examples Workbook
Click here to download the Excel workbook with the examples described on this webpage.
References
Pereira, D. G., Afonso, A., Medeiros, F. M. (2015) Overview of Friedman’s test and post-hoc analysis
Available through ResearchGate
Demsar, J. (2006) Statistical comparisons of classifiers over multiple data sets. Journal of Machine Learning Research.
https://www.jmlr.org/papers/volume7/demsar06a/demsar06a.pdf
Your site rules over them all!
My problem:
16 subjects tested 4 interfaces (all tested all, random order), with a task of identifying a target. We also varied targets, randomized. We wanted to see if there is a difference between the 4 interfaces. We measured identification speeds (milliseconds), resulting in a few hundred data points. The speed distributions are not normally distributed. We were told that Kruskal-Wallis (directly comparing interface speed distributions) is not applicable as we have a within-subjects design, so we should use a dependent non-parametric test such as Friedman’s. How to do that? In every example we have seen the data is formatted by subject and interface (group), and there is only one result for each group; we have over a dozen for each group. Have we misunderstood something?
Hello Antti,
Glad that you like the website.
Do I understand correctly that there is data for each of the 4 interfaces (within-subjects factor) for each of the 16 subjects?
Based on your statement that there are over a dozen results for each group, it seems that there is another factor. Can you provide more details about this “factor”?
Charles
Hello Charles, I’m impressed by the speed of your response!
Yes, there is data (13-15 samples of identification speed) for each of the 4 interfaces for each of the 16 subjects. This was a field experiment, so yes, there are some factors involved: each subject visited 4 positions. In each position, they performed 4 target identification tasks for each of the 4 interfaces (changing position after performing these 16 tasks). Order of positions and interfaces were counter-balanced. We had 12 potential targets, randomized for the tasks. Basically the corpus should be 16x4x4x4 = 1024 data points, but we lost some due to a bug in sw, hence the “13-15”, not 16.
Perhaps I should avoid “group”. We have subjects, interfaces, positions, targets and task measurements. How to analyze? Which is independent of which? We are mainly interested in differences in interfaces, but sure, need to analyze other effects as well.
Grateful for your response already!
Hell Antti,
The devil is in the details. Understanding these details is probably necessary to determine how or whether Friedman’s test can be used.
Charles
Charles,
I guess you are right about the details. Our paper has already been reviewed by some 15 reviewers, but nobody has been able to provide a good, detailed solution, except one told us just to use ANOVA (I guess because all comparable experiments seem to go with it), or as one required, due to within-subject design, Friedman’s test. This is not an easy field! Hence we are now desperately seeking for further assistance 🙂
As we understand Friedman’s test, we should compose a table of subjects and interfaces, and have a result (single number) in each sell:
I1 I2 I3 I4
S1 1040 2251 3311 1016
S2 2051 3912 1129 997
S3 1993 5551 2123 1052
….
Then the rows are ranked:
S1 2 3 4 1
S2 3 4 2 1
S3 2 4 3 1
…..
and summed:
7 11 9 3
However we have those 13-15 measurements for each cell instead of a single number. We feel that some statistical properties are lost in plain ranking – and that the selection of a this single measure is quite critical. Mean? Median? Variance completely forgotten?
When we use median, in one row there happens to be only ~10ms difference between the medians of two interfaces (our results lie in range 2000-80000ms) – and ranking changes the results hugely with only 16 subjects (15-1, 14-2 for a winning interface is significant, 13-3 not any more, depending on post hoc + family-wise correction). Okay, perhaps we can just round our results and this would be a tie.
If we had 32 subjects and only 8 samples, or 256 subjects with 1 sample, this method seems to yield more resolution. With over 700 data points but only 16 subjects, Friedman+any post hoc seems too simple.
Could you please elaborate a bit further, Charles? Are we on to something? Do we need to invent our own method?
Antti,
I am still trying to understand better the scenario that you are trying to model. Friedman’s Test is essentially a non-parametric version of the One-factor ANOVA with repeated measures (which is, in turn, equivalent to the Two-factor ANOVA without replications).
Are you looking for a nonparametric version of ANOVA with one between-subjects factor and one within-subjects factor, as described at
https://www.real-statistics.com/anova-repeated-measures/one-between-subjects-factor-and-one-within-subjects-factor/ ?
Charles
Is it possible to get negative value of Q?
I haven’t checked, but probably not since Q is supposed to have a chi-squared distribution, which is not defined for negative values.
Charles
Hi, thanks for the explanation, I need help with my research.
I observed an animal for 6 months, and I try to compare the differences in different groups of behaviors during the process (one group of positive behaviors and the other of negative behaviors).
The problem is that I do not have the same size of observations in the 6 months (in one month I have 8 observations and in another I have 24).
How do I use Friedman on that? Or should I use a kruskal wallis? (since it’s the same sample over time, I thought the correct test was Friedman)
Hi Charles,
First of al, thank you for making discussions like this which are so much easier to follow.
I want to ask if is it also possible to use Friedman test if the data I collected are not ratings. To illustrate using your example above, instead of scores of 1-10, I simply asked which of the 3 (white, red, and rose) he prefers? I’m thinking if I can treat his answer as rank 1 then for the two he didn’t choose, can I simply assign a tied rank of 2.5? Is Friedman test still applicable in this case? Thank you in advance!
Simon,
Thank you for your kind words about making the discussions easier to follow.
If I understand correctly, each subject chooses the type of wine he=she prefers and this wine is assigned the rank 1 and the other two wines are assigned the rank 2.5. You can certainly use Freidman’s test in this case. Keep in mind this is a test of the specific situation that you have described. This is equivalent to each subject assigning a rating of 1 to one type of wine and 0 to the other two.
Charles
Thank you as always, Charles! Happy New Year!
As usual, a job well done! Indeed, you have a way of making things look so easy to understand and apply. In fact, I always ask my students to refer to real-statistics for further information and support about statistical concepts and procedures!
Keep the good friendly work up!
Thank you very much for your kind words. I try my best to explain things in a clear and as simple as possible way. I don’t always succeed, but I try to do the best I can.
Charles
Dear Sir, i saw the formulation of nemenyi test ia different in KW and Friedman test, why is it different.. Thank you very much
Abdul,
Each is a modification of Tukey’s HSD test, appropriate to the KW and Friedman test. They are different because the goals of the KW and Friedman test are different,
Charles
Goog Morning Charles Zaiontz,
I’ve tried your same table with the same formulas, but I don’t find a good result, even when I give the same score to all the wines (by each Taster).
Normally, if each taster gives the same mark to all the 3 wines, the right conclusion should be “No difference”, but it says here that there is a “significant difference”.
I don’t understand.
NB: I’ve first rewritten your example with its scores, and I’ve found the same results. Then, to be sure, I’ve changed only the scores to give the same score to the wines by each Taster. And surprisingly, it says “Significant Difference”.
(p-value = 4.0681E-243 < 0.05).
Could you explain me how is it possible? Or which error I could have done?
Thank you.
Achille,
I agree. If all the tasters give the same scores you should not get a significant result.
If you email me an Excel file with your data and results, I will try to figure out what went wrong.
Charles
In the “Friedman Test Analysis Tool” page the p-value = .048668 in cell G9 while the p-value = .041077 in cell J10. Since it is below .05, does this mean that there is a significant difference between the three types of wines? I am asking since on this page it says that the data shows that there is NO significant difference between the three types of wines.
Hello Alexis,
In the example shown on the webpage, p-value = .408 and not p-value = .0408. This means that there is no significant difference.
On the examples workbook, I give two examples: one with p-value = .408 and another with p-value = .0408. The first of these shows a non-significant result, while the second shows a significant result.
Charles
In the “Friedman Test Analysis Tool” page the p-value = .048668 in cell G9 while the p-value = .041077 in cell J10. Since it is below .05, does this mean that there is a significant difference between the three types of wines? I am asking since on this page it says that the data shows that there is NO significant difference between the three types of wines.
Just wanted to say this website is fantastic, I solved a problem in 5 minutes after spending hours on finding a proper way to appropriate do the post hocs in SPSS and R.
Thanks a lot!
Alberto,
Thank you for your comment.
Charles
Hi
Can you tell me what is the critical value if N=200 and K=3 for a significance level of 5%?
Hi Satvik,
As explained on the webpage, the critical value is the critical value for the chi-square distribution at alpha = .05 with df = k – 1 = 2.
Charles
Dear Charles,
I have an experimental design in which a same groups of subjects is measured under three different conditions, that is, in a neutral condition (A), by applying a foot orthosis of one kind (B) and by applying a foot orthosis of a different kind (C).
So I performed an ANOVA for repeated measures; it resulted highly significant as expected, and then two orthogonal contrasts, the only ones interesting for this experiment, that is:
A vs (B+C)
B vs C
Even after applying Bonferroni correction with k=2, both resulted significant with p < 0.001
However, the normality condition is not satisfied for the input data, so I repeated the test by using the non-parametric Friedman test. Also in this case the test is significant; my problem is that post-hoc tests are only for pairwise comparisons, while I wish to test the two contrasts as above, that is 1) A vs (B+C) and 2) B vs C. Is there a way to do this?
Moreover, the Nemenyi and Conover test give very different results: while for Nemenyi B vs C is not significant (p = 0.16), with Conover B vs C is highly significant (p = 0.000179), this last result is consistent with pairwise signed-rank tests in the Real Statistics Tool.
Which one should I trust more?
Thank you very much for your help
Piero
Dear Charles , Looking for omre more indepth Friedman test in Excel, i came along your site. I tried to rebuild the sheet with the wines, but i am unable to do the second ranking for the adding. What ERxcel command is associated to build the ranking you display?
In your set which i downloaded, this Friedman with the wines is unfortunately not there. If possible maybe you can mail mec the sheet as presented in this document.
Thank you in advance,
Ger
Hello Ger,
The worksheet for this example is available on the ANOVA 2 examples workbook. You can download this workbook at
Real Statistics Examples Workbooks
Charles
Dear Charles,
Please am trying to identify the Strongest factor that affect cost control during construction. The data is scheduled to be ranked on the scale of 1-5 (1=less important, 5=highly important). can I use friedman test for the analysis and what posthoc test can I use to identify the highly ranked factor.
Thank you.
I would more information about your situation before I could answer your question.
Charles
When you have identified factors affecting a system, and you want to know how severe is each factor. In the survey, you ranked the factors on the scale of 1-5 (1 to mean very strong and 5 to mean very weak). what statistical tool is suitable for the analysis in order to know the most severe factor.
This depends on how you conduct your test and what you mean by “the most severe factor”.
Suppose you have 5 factors and each of 10 subjects rates each of the 5 factors on a scale of 1 to 5. The factor that has the lowest total rating from 10 to 50 (or mean score from 1 to 5) would be strongest. This would cover the sample. You could now use a statistical test to determine whether there are significant differences between the factors for the entire population of potential subjects. If there is a significant difference you can then use one of the post-hoc tests described on the Real Statistics site to determine which factors are significantly different.
Suppose factors A, B, C, D, E had mean scores of 1.3, 1.4, 4.1, 4.2, 4.2 respectively and A and B are shown to be significantly different from C, D and E, but not significantly different from each other, then you would conclude that A and B are the strongest. (Note that I didn’t actually perform a Friedman post-hoc analysis to reach this conclusion, but this the general idea.)
Charles
Charles,
Friedman’s test is for one factor repeated measures. Is there a non-parametric test for 2 factors repeated measures (more than 2 treatment groups and individual subject within each group have multiple assessments over time) ? Since the Friedman’s statistic is distributed as a chi-square, can we extend this test the difference in treatment effect? Each treatment group is independent from each other, so the test statistic can be added with modified df (ie, sum)…
Just a thought.
Looking forward to receiving your guidance soon.
-Sun
Hello Sun,
I don’t know of a two factor Friedman’s test. I don’t know whether the approach that you are suggesting will work.
I found the following reference on the Internet, but I don’t know whether or not it is useful to you.
https://www.jstor.org/stable/2287186?seq=1#page_scan_tab_contents
Charles
Thanks for your prompt response and the article!
-Sun
Charles,
For the Conover post hoc analysis, please correct the inequality direction for significance. If the means are significantly different between the two groups tested, the t test statistic value is greater than the critical value.
Thanks,
-Sun
Hi Sun,
You are right again. Thanks for finding yet another error. You are fantastic! I really appreciate your diligence. I have now make your suggested correction on the webpage.
Charles
Charles,
I have a couple of points to bring your attention:
1. Friedman statistic (Q=1.79) obtained in Figures 1 and 2 are based on the formula where the ties were not taken into consider. Should we adjust for ties as there are ties presented in some columns.
2. The values presented in Figure 1 under the “Friedman Test Analysis Tool” are not accurate. The values should be at least similar to what we obtained in Figures 1 and 2 under the “Friedman Test” section as the input data are exactly the same. Please note that the values provided by the tool have the ties=TRUE option (ie, tied ranks were adjusted in calculating the Q statistic). Correct values should be as follow:
Q-stat 2 Q*-stat 1
df 2 df1 2
p-value 0.367879441 df2 22
p-value 0.383995231
Please update the text when you get a chance.
Thanks,
-Sun
Hi Sun,
1. Yes, this example doesn’t use the ties correction. I did this since it is easier to present the process without the complication of the ties correction.
2. The data for this example is different from that of the first example. This is why the results are different. I have now stated this on the webpage. Thanks for bringing this issue up so that I could clarify it.
Charles
Dear Charles,
I am searching for Friedman test and Holm Post Hoc Procedure. Can you help me out in this problem
Ali,
The Real Statistics website doesn’t describe the Holm’s post-hoc procedure. I will add this shortly. In the meantime, see
https://en.wikipedia.org/wiki/Holm%E2%80%93Bonferroni_method
Charles
Dear Charles,
Thanks for your website. It is very helpful and comprehensive.
I am doing a workplace culture study, for which I surveyed 90 leaders in the organization on 7S framework of Mckinsey. total 35 questions (5 questions for each S), on a scale of 1-4.
what research models/ tests do you suggest I can do to find out the 7S score, alignment among each S, and the possible gaps and strengths.
Looking forward to hear from you.
Regards,
Deepika
Deepika,
I am not familiar with the 7S framework of Mckinsey. What hypothesis are you trying to test?
Charles
The hypothesis I want to test is, if there is alignment between each S then it indicates good culture. if there is any S which is not in alignment with other S’es, that would be the area of improvement for the organization.
until now, I only compared the mean of each S and defined strengths and area of improvements through it. But I want to do a more detailed analysis. I saw this links where they have done analysis of 7S using statistical tools. but unfortunately I didn’t understand much out of them 🙁
https://www.researchgate.net/publication/315940491_Analyzing_Organizational_Structure_based_on_7s_model_of_McKinsey
http://hrmars.com/hrmars_papers/Strategic_Assessment_based_on_7S_McKinsey_Model_for_a_Business_by_Using_Analytic_Network_Process_(ANP).pdf
If you can give any inputs based on these links, it would be very helpful.
TIA,
Deepika
Deepika,
The Abstract for the document in the first link refers to Cronbach’s Alpha, K-S test and t test. These are all described in the Real Statistics website. I am sorry, but I don’t have time to read the full document. The second link generates an error and so I was unable to look at it.
Charles
No problem. Thanks a lot.
I will check Cronbach’s Alpha, K-S test and t test on the website.
Regards,
Deepika
Dear Sir,
Is there a chart or graph for friedman test and wilcoxon signed rank test? Please help me out, i already have my results and I’m having trouble in presenting my data.
Daniel,
The Real Statistics website and software don’t provide such a chart or graph. What sort of chart or graph do you have in mind?
Charles
Dear Sir
I am doing a study in which I want to test whether a new variants of a product have a better taste than the original.
In this, I plan to give around 50 respondents samples of Product A (original) and Product B and C (New Variants) and ask them to rate each one on a 5-point scale according to taste (Strongly Dislike to Strongly Like).
Can I then conduct the Friedman’s Test on this data to see if there is any significant difference in the three samples?
Regards
Rachit,
Yes, but it is also possible that repeated measures ANOVA might work as well (although with a 5-point scale some of the assumptions might fail).
Charles
Great Sir!
So I am not sure about my data being normally distributed hence I had decided to go for the Friedman’s Test (non-parametric).
Also, would you suggest I use a 7-point scale or stick with the 5-point scale? And should I use repeated measures ANOVA then or stick with the Friedman’s Test?
Regards
Thank you, this website has been very helpful.
I have a question:
I have conducted an experiment on osmosis in potatoes, using the gravimetric method. This means that I have measured the mass of my potato disks before and after submersion in a series of sucrose solutions. I have calculated the %-change in mass of the disks, and plotted the mean changes in a graph. Some of the error bars overlap, and thus I’d like to conduct a statistical test to see whether there is any real difference between the means.
Would the repeated measured ANOVA or the Friedman test fit my data? I’m very confused about what statistical test to use, your help would be appreciated.
Mia,
Since the subjects are the same before and after, you need to use a test like (1) paired t test, (2) Signed ranks test, (3) repeated measures ANOVA or (4) Friedman’s test. Since you only have two time periods you don’t need tests (3) or (4). If the assumptions for the paired t test are met (principally normality of the differences) then you should choose test (1). If not then test (2) is probably the way to go.
Charles
Thank you!
Dear Zaiontz,
First of all, thank you for your website.
If you have the chance to give me a hint, I would appreciate it.
I have a dataset consisting of 48 subjects answering to 5 items (similar to your wine example). The response is ordinal (a rating 1 to 7). But for each of the five items, the subject answered more than one time (25 times).
Do you have a suggestion of an approach? I would not like to average the 25 responses.
Thank you!
Juliane,
Why did the subject answer 25 times? Is there any reason to believe the answers would be different each time?
What hypothesis are you trying to test?
Charles
Dear Charles,
First of all, thank you for Real Stats!
Two questions:
1) Any chance to implement exact p-values for Friedman test?
2) Why “Q” (like for Cochran test) not the Fr or something?
Sergey,
1. Thanks for your suggestion. I will add this to the list of potential future enhancements
2. No particular reason.
Charles
1) I have no enough competence but maybe it would be useful resource – https://www.ncbi.nlm.nih.gov/pmc/articles/PMC5267387/
Thank you Sergey. I will look at that document.
Charles
Professor,
I was wanting to clarify if this would be the correct stats analysis for the ranked data I have obtained. I had 20 surgical residents rank 11 study aids from 1 “most important” to 11 “least important. I then had 10 surgical faculty rank these same study aids in a similar manner based on their perceived importance to resident education.
I was wanting to determine a couple of things. First, I was hoping to see if there were any statistical differences in the rankings obtained from residents in different years of their training (example: intern vs chief resident). I was also wanting to see if there was an appropriate test to analyze if there was a difference between the answers obtained from the residents versus the faculty.
I would appreciate any thoughts! Thanks in advance.
Aaron,
1. To determine whether there is a difference in the means between two independent samples you could use a t test or a Mann-Whitney test (provided the assumptions for that test are met).
2. In your case, you seem to want to test whether ratings by two different raters are consistent. There are a variety of (inter-rater reliability) tests for this: e.g. Kendall’s W, Krippendorff’s Alpha, Gwet’s AC2, Weighted Cohen’s Kappa.
3. I am not sure how valid these inter-rater tests are for the same person in different time periods.
Charles
Can you use this test to determine whether a time series has seasonality? One website I looked at said I could. If not, do you know of another test that could do so through excel?
Abby,
I explain how to handle seasonality in the website, but don’t provide a test for seasonality. On of the following websites might be helpful. The first one used Friedman’s test.
https://ec.europa.eu/eurostat/sa-elearning/combined-seasonality-test
http://stats.stackexchange.com/questions/16117/what-method-can-be-used-to-detect-seasonality-in-data
Charles
Hello Professor,
I performed a test for my thesis. My project is about the way the number of contact points of a haptic feedback device on a single finger and their configuration, will affect the perception of shape of a virtual object to the user.
I have 4 different configurations and 12 shapes. The test was performed twice on each user thus giving me a total of 96 runs each of which has a specific confidence level from 1 to 5 where the user states how confident he/she was when trying to figure out the shape.
Can you please point out how I will use the Friedman test and any advice you could please provide?
Constantinos,
Before I can do that, please explain what hypotheses you want to test.
Charles
Can we use Friedman to test whether music has an effect on fermentation?
We brewed one batch of beer and split that batch into 5 different fermentations. Four of the batches had a different sound/music played to it with one having no sound/music (control).
We want to know if sound/music plays a role in the fermentation of beer. Would a Friedman test work for this and if not what would be the best test?
Carson,
If I understand correctly, you have essentially one factor with 5 levels and no replications. You won’t be able to test much with such a limited sample.I guess you could use Friedman’s if you had more than one batch of beer.
Charles
Hi Professor,
Can I use Friedman test in order to compare demographics with business opportunities?
eg. how can I compare type of school, years in operation, basic ed population, senior high population etc. and assess their difference with business opportunities?
Thanks much,
Rica
Rica,
It doesn’t seem like a fit for Friedman’s Test. What test you should use depends on how do you measure business opportunities. You could look at this as a regression problem with type of school, years in operation, basic ed population, etc. as the independent variables. You could look at this a many-factor ANOVA problem.
Charles
Thanks a lot! I was also a bit confused when I was asked to use it. Then, the professor asked us to use Chi-square. Will it be applicable?
Big thanks for your help.
Rica,
Chi-square can be used for these types of tests.
Charles
Thank you so much!
Dear Sir
I have done my research on customer satisfaction for an automotive company. Being B2B sample size is 31
and factors are price ,mileage, aftersales service,maintenace cost ,spare parts availability and comfort.Each factor being ranked from 1 to 5. Now how can i use Freidman test in it.
Could suggest some other test al²so as my objective is to increase sales
Thanks & Regards
Dear Professor,
I’d like to use a non- parametric test to my data ( number of cells after 3 different kind of treatements). I’ve tried different, but I’m not sure about which one would be the most appropriate. Do you, gently, have some advices?
Thank you in advance
Rosa, I would need more information to be able to answer your question.
Charles
Hello Professor,
Thank you for the great work you have put into this site.
I have a question about the appropriate test to use: Friedman Test of the SRH test.
The data is as follows. I randomly divided 24 animals into 3 treatment groups (each animal received one of the three treatments). Each animal was evaluated for functional deficits on days 1, 2, 3, 4, 5, 6, and 7 post-injury. The functional deficits are scored as either 0, 1, 2, 3, 4, or 5. My data failed the normality test for each day. I want to know the appropriate statistical method to analyze the group effects as well as the time effect.
I believe I need to use a non-parametric, repeated-measures, two-way ANOVA for my data set. From my understanding, the Friedman test is not appropriate since it does not treat individuals as groups. Is the SRH test appropriate for my data set (i.e. does it consider repeated measures)? Thank you for all your insight.
Hello John,
I don’t know of a non-parametric, repeated-measures two-way ANOVA. Perhaps it exists, but I am not aware of it.
How badly did your data fail the normality test? Did you try to use a transformation to normalize your data?
Another approach might be to analyze the group effects separately from the time effects, in which case standard tests could be used.
Charles
Hello Professor,
When I rank the data, it passes normality. So I presume that I can then use a repeated measures two-way ANOVA on the ranked data. I have tried a couple transformations, but not many. Thank you.
John
John,
That is not a surprise since ranked data should be normal. The results will apply to the ranked data and not necessarily to the original data, but this approach may be useful and is the basis for many of the non-parametric approaches.
Charles
Dear Dr. Zaiontz,
I would like to ask whether there is a difference between the result of the Friedman test and the Wilcoxon test if participants are assessed on two occasions. Can I use Friedman test in such a situation? I ask because I have found somewhere an information that the Friedman test can be used for 3 or more correlated samples.
I would be grateful for your advice.
Joanna
Joanne,
Friedman’s Test is essentially the Wilcoxon’s Signed Ranked Test where there are 2 or more (repeated measures) groups. When there are two groups the results should be the same, but I suggest that you try using both methods and see for yourself.
Charles
Hii..
May i ask some question regarding how to differentiate blocks and treatment in Friedman test? Izit always that blocks is row , and treatment is column?
Thanks…
Evonne,
The treatments are the columns and the subjects are the rows. Each subject can be considered to be a block.
Charles
Hello:
I am trying to download Real Stats for use with my Mac, using Excel 2008. It seems to have downloaded (it is listed as an Add-On) but I can’t seem to open (or find reference to) the application in Excel. Might there be a compatibility problem? I would like to be able to run a Friedman’s Test. I’ve never worked with add-ons in Excel before but this seems like a potentially very useful tool.
Laurie,
Unfortunately, Excel 2008 does not support VBA, which is a requirement for any add-in, including Real Stats. You will need to use either the Windows version of Excel or Excel 2011 or Excel 2016 (Mac) to use Real Stats.
Charles
Dear Dr. Zaiontz,
I have a sample of 100 people who ranked 14 elements based on their relevance. I have been looking for the right test to analyze if there exist a significant difference in the rankings. I have not found any other alternative that the Friedman tests and then post hoc (Wilcoxon’s signed ranks test on all 45 pairs, using a Bonferroni correction). However, i found in a blog that one assumption of Friedman test is that there should be repeated measures from the same participants (at least three). So, according to the blog, it is supposed to be used only for repeated measures. Do you think that I can still use this test for my specific research case? Thanks for your advice!
Christian,
Friedman’s should be used with repeated measures. Since presumably each of the 100 people ranks each of the 14 elements, this is a repeated measures problem. Whether or not Friedman’s is the correct test depends on what exactly you are trying to test. If you want to know whether the rankings for the 14 elements are the same, then Friedman’s could be correct (or even possibly ANOVA with repeated measures). It also depends on what sort of values you are using for the rankings.
If you are trying to determine whether the 100 people agree in how they rank, then you should consider using ICC or Kendall’s W, depending again on how you do the rankings. These are covered on the website. Just insert the appropriate test in the Search box.
Charles
Hi – I wanted to check on validity of using Friedman’s test for a two factor anova – I have two types of implant materials that were evaluated histologically at 1 week and 4 weeks post-implantation. I believe that 1 factor would be the type of implant material and the 2-factor would be time – this is not repeated measures since samples for each type of implant material are different at each time point – please let me know if Friedman’s test is correct and if so – do I undertake post-hoc tests similar to a two factor ANOVA but using Dunn’s-KW-type tests?
Hello I am interpreting a Mixed ANOVA Test I have 2 Groups (100/Group); Control and Treatment (between subject factor: Independant variable), which had their Phosphate blood value (dependent variable) measured over time (within subject factor) (0h 12h 24h 36h 48h 60h and 72h).
If I am correct this is a 2×2 Mixed ANOVA.
But first testing the assumptions.
I have about 20 outliers which I double checked and decided to keep them and make a notice of it in my interpretation. I transformed my data to meet the normality assumption but lost on variance homegeneity assumption, Since ANOVA is robust to normality but not homogeneity of variance I kept the original data without transformation.
Now I am about to proove the Covariance assumption.
If I do not meet the covariance assumption I will turn to a Non-parametric test.
Now my question is: what is the proper Non-parametric test for a 2×2 Mixed ANOVA?
Thank you.
Hello Claude,
This does look to be a 2 x 6 Mixed ANOVA. I agree that ANOVA is more sensitive to violations of homogeneity of variances than the normality assumption. Generally, I would simply use a sphericity correction rather than worrying about whether the sphericity assumption holds. See Sphericity for more details.
The most commonly used substitute for repeated measures ANOVA is a repeated measures MANOVA (where you don’t need to satisfy the sphericity assumption).
Charles
Why 12, why is there a 12 in the equation – where is 12 coming from?
Thank you
The 12 is just the result of some mathematical calculation. You would have to look at the mathematical derivation of the Q statistic.
Charles
Dear Professor
First, thank you very much.
I have a similar case of repeted measures but I dont have subjects and I have treatments with differents repetitions each one per each measure time. How can I work with these type of data?
Dani
You would need to use a different type of model, based on regression or linear mixed models. I will be exploring these sorts of models shortly.
Charles
Dear Mr. Zaiontz
Let me first thank you for your explanations. I’ve got a question regarding post hoc tests after a Friedman test. In my study N=301 subjects were asked to rate 10 items about their relevance (how important is item 1: “very important”, “rather important” etc.; item 2: “very important”, “rather important” etc., …). My final aim is to get a ranking list of these 10 items, i.e. which one is regarded as the most important, the second-most etc.
I did a Friedman test and got a significant result. I assume that I’m not allowed to take the Mean Ranks and “arrange” the ranking list, i.e. take the one with the lowest Mean Rank, then the one with the second-lowest and so forth … so how do I get a ranking list? Do I have to do Wilcoxon tests for EVERY pair of items (that would be 45 comparisons)? Or would it be enough to compare each item with the one above and the one below according to the Mean Ranks?
It might be a bit of a dumb question, but I’m really confused right now.
Thank you in advance and greetings from Switzerland,
Eveline
Eveline,
If what you want is a ranking of the 10 items, I can’t think of any reason why you couldn’t just order the items based on their total (or mean) ranks. The only problem with this, is if say item C has a lower rank than item E but the difference is not statistically significant. Presumably, the Friedman’s test just told you that at least two of the items have a significant difference in mean rank, which is obviously not that helpful.
One approach to post hoc testing is Wilcoxon’s signed ranks test on all 45 pairs, using a Bonferroni correction. Based on such post hoc tests with just three items A, B and C, you could find that A and B are the only pairs that are significantly different (say A < B), which presumably would mean that C is between and A and B, although not significantly different from either one of them. Charles PS: From Wikipedia, Post-hoc tests [to Friedman's test] were proposed by Schaich and Hamerle (1984)[1] as well as Conover (1971, 1980)[2] in order to decide which groups are significantly different from each other, based upon the mean rank differences of the groups. These procedures are detailed in Bortz, Lienert and Boehnke (2000, pp. 275).[3] Not all statistical packages support Post-hoc analysis for Friedman's test, but user-contributed code exists that provides these facilities (for example in SPSS [1], and in R [2]) References 1. Schaich, E. & Hamerle, A. (1984). Verteilungsfreie statistische Prüfverfahren. Berlin: Springer. ISBN 3-540-13776-9. 2. Conover, W. J. (1971, 1980). Practical nonparametric statistics. New York: Wiley. ISBN 0-471-16851-3. 3. Bortz, J., Lienert, G. & Boehnke, K. (2000). Verteilungsfreie Methoden in der Biostatistik. Berlin: Springer. ISBN 3-540-67590-6.
Thank you for the insightful articles you provide. I have a project to deliver and i would request you to suggest me which is the best method/ test to conduct my study.
I have a 6 month data set with 13 students(student 1, student 2, etc) and 11 tests(test1 – test 11) and the average time taken by each student to complete each test over 6 months. The data is not normal.
I want to find out, for each test-wise, which students are underperforming or overperforming.
I am proving a rough sample. Please suggest.
test 1 test 2 test3 test 4 ———– test 11
student 1 45.56 8.56 0.56 50.56
student 2 23.25 9.65 8.25 32.65
student 3 22.32 24.56 16.32 24.56
student 4 15.12 33.26 25.12 44.26
student 5 80.32 45.00 15.32 45.00
–
–
student 13
Ron,
It really depends on how you define under- or over-performing. You can look at this as a problem of identifying outliers. The website has several webpages that address this issue. Please use Search to find these pages.
Charles
Hi Charles,
Thank you for your quick reply.
I am thinking of applying IMR control charts for subgroup 1 (each individual is considered as one subgroup). Then i would target those individuals who would fall below or above the control limits.
I am confused with one thing. Could you please guide me whether i should consider 1 sigma, 2 sigma or 3 sigma as my control limits?
Thank you for this wonderful site. I have gathered so much knowledge from here.
Regards,
Ron
Ron,
Good to hear that you are getting value from the site.
There is no clear rule regarding 1 sigma, 2 sigma or 3 sigma. I generally use 2.5 sigma, except for very large samples where I may choose a larger value like 3.
Charles
Thank you Charles for all your support. Now i can carry out my analysis.
Hi Charles,
I’m glad that I could be of service for the next release regarding the SRH test! It is relatively unknown, but can be rather effective in the right environment, especially with non-normal data! I forgot to mention this in my original post, but the SRH test only works if the ANOVA is balanced. So there needs to be an equal number of observations for each level of each factor…of course, this will not usually be a problem for repeated measures designs unless one or more of the subjects are unable to complete the testing. You may have figured this out already, but I thought it would be best to clarify this restriction. Thanks again for running a great site!
Hi Charles,
Thank you for your tutorial, i am new to statistic. I would like to know how can i determined or select from the table based on my amount of subjects. ie N=5, N=6.
From the table of critical values for three conditions, how should we determined which P values to choose from?
Thanks!
Sorry, but I would have to see the table that you are using since I am not providing such a table from my site.
Charles
Hi Charles,
This is one of best explanations I have came across while wanting to know a bit more about Friedman statistic… Thank you!
I have a couple of questions on the method and conclusion:
1. Can I use this method as a product tradeoff analysis like conjoint analysis and having no levels?
As an example, lets say I ask people to share preferences of disruptive technologies. I give them $100 to distribute in the list. I then run Friedman test on collected samples to determine whether difference in choices were significant.
2. You mention – as p value > 0.05 we conclude there is no significant difference between the three types of wines.
>> What if p was < 0.05 and in this case does the Ranking order matter? How/When do I definitely say people like first Red then White and then Rose?
Andy.
Andy,
I am pleased that you found my explanation of Friedman’s test useful. The following are some observations about your two questions.
1. I am not sure why you saw “no levels”. Suppose that people have three disruptive technologies to choose from. They assign their $100 among the three technologies. My initial thought is that you perform Friedman’s test (or repeated measures ANOVA if the assumptions are satisfied) to determine whether there is a significant difference between the three technologies. Offhand I don’t see any problem with this approach, but I frankly haven’t enough time to think through this response in sufficient detail to make sure that this is so.
2. You can order the average preferences as you have indicated, but just because White has a higher ranking than Red in the sample, doesn’t mean that this represents a significant difference (with respect to the population). You would need to perform a post-hoc test to determine this. I have provided tests for post-hoc tests for ANOVA. I am now adding some for Kruskal-Wallis and soon I will look at follow-up testing for Friedman’s test.
Charles
Dear Charles Zaiontz,
I am using Friedman test to compare three different conditions. I have 33 participants who took part in each condition.
My question is can I use Friedman test when the three groups are of unequal size? e.g. group 1 12 particip., groups 2 21 particip. etc.
Thank you in advance.
Katerina
Katerina,
Friedman’s test would be used when you have 33 participants who experienced all three conditions. In this case the sample sizes would all be the same, namely 33.
If you are instead looking at three independent groups, the participants in each group experience one and only one condition, then you want to use fixed factor ANOVA, Kruskal-Wallis or some other similar test.
Please describe your experiment more clearly.
Charles
To check the p-value use formula: CHISQ.DIST.RT (1.79,2)
Lucas,
Yes, that is correct.
Charles
Dear Mr. Zaiontz,
I have a very specific problem (surprisingly similar with the one posted in the comments above) and am a bit confused on which statistical test to use. I am sorry if I bother you but I do not understand what you mean with simple arithmetic?
I have investigated the effect of 5 different treatments and used a scale between 1-5 to evaluate the effect. I repeated the investigation 6 times. My data is therefor ordinal (ranked), non-parametric and not normally distirbuted.
However, I also calculated the means of each treatment over time of the 6 runs.
I’m not sure if I have to compare the means of the 5 Treatments or do not use the means at all and make a Friedman test for each treatment of the six runs. I would be very thankful for any Information on how to proceed and what statistical test to use. (I was thinking about Man-Whitney U or Friedman’s test?)
Thank you!
Noemi,
I need the some additional information before I can answer your question. First of all I need to better understand the experiment. In particular,
1. Are all 5 treatments applied to each of the 6 people in the sample?
2. Are the 5 treatments applied to different people (for a total of 30 people in the study)?
3. Is the sample divided into 5 groups, one for each treatment, where each person in the sample gets one treatment over 6 different time intervals?
Before answering the question about which statistical test you should use, I need to understand what hypothesis are you trying to test.
Charles
Dear Mr. Zaiontz,
Your article was really helpful. I just want to confirm the use of Friedman’s test for analysis of data collected through 5-scale likert-type questions. Basically, we have 5 factors and we want to find which one of these are more effective. We have gathered data using 5-scale Likert-type questions with ordinal ranking from 1 to 5 (ranging from Strongly Disagree to Strongly Agree). Can we get a sort of ranking of these five factors according to their effectiveness using this test?
Thank you!
You don’t need to use Friedman’s test to get a ranking of the five factors. Simple arithmetic is sufficient. What Friedman’s test will tell you is whether any differences between the mean rankings are statistically significant (or are just due to random effects).
Charles
Thank you very much Mr. Zaiontz!
So that means that i can find the difference (significant or insignificant) between 4 or 5 groups of data? Basically, it is for research thesis and we cannot simply deduce something based on the ordinal 5-scale. We intent to use t-test for comparing pairs of data set but it will be a good thing if we could test all 5 of them together?
Friedman’s Test tests all 4 (or 5) groups together to determine whether the 4 groups statistically have the same mean (the null hypothesis). If the answer is yes, then you are done. If the answer is no (i.e. at least 2 of the groups have different means), then you would typically perform a t test (or Mann-Whitney test) to determine which two groups are the ones with different means (or some other similar test).
Charles
Dear Mr. Zaiontz,
I am writing to ask which data analysis method is appropriate for non-parametric 2 within-subject factors ANOVA.
My dependent variable is error rate (0-1), which does not apply normal distribution. I transformed the DV data, and conducted the repeated measures ANOVA. I am interested in the results based on non-parametric methods too. But I did not found a proper way yet.
Thanks!
Jiahui
Jiahui,
Friedman’s test is a way of conducting a non-parametric repeated measures ANOVA.
Charles
I know Fiedman’s test is the non-parametric alternative to the one-way ANOVA with repeated measures. Can I use Friedman’s test for two-within factors ANOVA? In case I am interested in the non-parametric two-way repeated ANOVA, which method I can use?
I don’t know of any nonparametric method for two-way repeated ANOVA.
Charles
Hi Charles,
There is actually a test for a nonparametric 2 way ANOVA with replication/repeated measures, called the Schierer Ray Hare test. Essentially, you replace the original data with their respective overall ranking, regardless of the level of either factor that they occupy.
You then perform a standard 2 way ANOVA on the ranked data, but you take things a step further by dividing the total sum of squares by the total degrees of freedom to get a “total mean square.” You then divide the individual sums of squares for the two factors and the interaction term (not the mean sums as you did to determine the F ratios) by this “total mean square” to yield an H ratio for the two factors and the interaction.
Provided each group has at least 5 elements, these H ratios can be evaluated against the chi-square distribution with the relevant degrees of freedom from the two way ANOVA. If either CS value for the individual factors is significant, then the groups differ in that respective factor; likewise if the interaction H is significant, there is a significant interaction between the factors for the groups in question.
Kevin,
Thanks for your very helpful comment. I will add the Schierer Ray Hare test to the next release of the Real Statistics software.
Charles
This was very helpful. Even more helpful were your comments for the Wilcoxon signed ranks test because it gave me the information I needed to calculate the 95% confidence interval for T and to calculate the effect size r. Increasingly, journal editors are asking for these. Could you provide information on how to compute a stander error for H (as provided for T) and the effect size r for the Friedman test?
Roger,
I don’t know of any commonly accepted values for the standard error or effect size for Friedman’s test, although Kendall’s W is often cited as an effect size for Friedman’s H. Here W = H/(m(k-1)) where k = the number of groups (treatments) and m = the number of subjects. Also used as an effect size is the r coefficient for Kendall’s W, which is r = (mW-1)/(m-1). In fact it can be shown that r is the average Spearman correlation coefficient computed on the ranks of all pairs of raters.
Charles
U were mentioned,
“effect size for Friedman’s H. Here W = H/(m(k-1)) where k = the number of groups (treatments) and m = the number of subjects.”
Do you know any reference of this.
See http://oak.ucc.nau.edu/rh232/courses/EPS625/Handouts/Nonparametric/The%20Friedman%20Test.pdf
Charles