Basic Concepts
We can use Grubbs’ test to detect the presence of one outlier in a data set that is normally distributed (except possibly for the outlier) and has at least 7 elements (preferably more).
Here we test the null hypothesis that the data has no outliers vs. the alternative hypothesis that there is one outlier. The ESD test should be used instead when there is the possibility of more than one outlier.
If you suspect that the maximum value in the data set may be an outlier you can use the following test statistic
![]()
If you suspect that the minimum value in the data set may be an outlier you can use the following test statistic
![]()
The critical value for the test is
where tcrit is the critical value of the t distribution T(n−2) and the significance level is α/n. Thus the null hypothesis is rejected if G > Gcrit.
There is also a two-tailed version of the test where G is the larger of the two G values described above and Gcrit is defined as above except that the significance level for tcrit is α/(2n). Alternatively, G can be calculated using the formula
![]()
Example
Example 1: Determine whether the data set {145, 125, 190, 135, 220, 130, 210, 3, 165, 165, 150} has an outlier.
The data set is shown in range A4:A14 of Figure 1. Using the Shapiro-Wilk test, we see that the data is not normally distributed. However, when we remove the data element 3, which seems to be a potential outlier (as shown in range K4:K14), we find that the data is normally distributed, thus allowing us to use Grubbs’ test

Figure 1 – Testing data for normality
Since we suspect that 3 is an outlier, we use the one-tailed Grubbs’ test. We show how to implement this test in Figure 2.
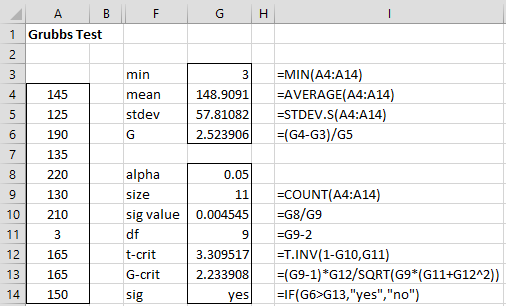
Figure 2 – Grubbs’ Test
We see that 3 is a little more than 2.5 standard deviations from the mean (cell G6) and that the test is significant (cell G14), meaning that 3 is an outlier (based on α = .05).
Worksheet Functions
Real Statistics Function: The Real Statistics Resource Pack provides the following array function to perform a one-tailed Grubbs’ test.
GRUBBS(R1, lab, alpha): outputs a 4 × 1 column range with the following entries: potential outlier, G, Gcrit, and test significance
If lab = TRUE (default FALSE) then the output is a 4 × 2 matrix with a column of labels added. alpha = the significance level (default .05). The potential outlier is either the maximum or minimum value in R1, depending on which is farthest away from the mean of R1. The test is significant, i.e. sig = “yes” if G > Gcrit and sig = “no” otherwise.
For Example 1, if you highlight the range P5:Q8, enter the formula =GRUBBS(A4:A14,TRUE) and press Ctrl-Shft-Enter, then the output that appears is displayed in Figure 3.
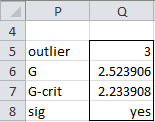
Figure 3 – Output from GRUBBS formula
Examples Workbook
Click here to download the Excel workbook with the examples described on this webpage.
References
Wikipedia (2014) Grubbs’s test
https://en.wikipedia.org/wiki/Grubbs%27s_test
NIST (2022) Grubbs’ test for outliers
https://www.itl.nist.gov/div898/handbook/eda/section3/eda35h1.htm
Grubbs, F. E. (1950) Sample criteria for testing outlying observations The Annals of Mathematical Statistics
https://psycnet.apa.org/record/1950-04973-001
I’m trying to figure out why the grubbs calculator at https://www.graphpad.com/quickcalcs/grubbs1/ is giving a different critical G/Z value.
As a hypothetical example, If have values of 1529, 1118, 1130, and 1175, using an alpha of 0.05, Real Statistics will give a critical G/Z value of 1.4625, but the Graphpad calculator will give a critical G/Z value of 1.48125. However, if I use an alpha of 0.025, Real Statistics will give a critical value of 1.48125. What’s going on here? Does Real Statistics default to a two-tailed test? Or perhaps the Graphpad calculator is incorrect? Any ideas?
Hello Aladdin,
Real Statistics does use the two-sided test. Does this account for the difference from GraphPad?
Charles
hi Charles,
If it is a 2-sided test, shouldn’t the formula in Figure 2 cell I10 be ‘G8/(2*G9)’?, This is concurrent with significance value alpha/2n, which is what Graphpad uses. Otherwise to achieve the 2-sided result, I agree with Aladdin’s solution is to change alpha from 0.05 to 0.025? Can you confirm this?
Hi Pui,
For this particular example, a one-tailed test was performed since 3 is suspected to be the outlier. I have made this clearer on the webpage.
If a two-tailed test were used then Aladdin’s solution would be correct.
Charles
Pui,
Just to be clear, the GRUBBS worksheet function performs a one-tailed test.
Charles
Hello Aladdin,
I mistated the situation in my previous response. I believe that the GRUBBS worksheet function performs a one-tailed test.
Charles
Sir,
I downloaded the Pack and started using.
When I closed XLS File and try to reopen XLS File. Ctrl+m Analysis Tools menu does not open.
What do you see when you enter the formula =VER() in any cell?
Charles
Hi Charles,
I wanted to get your opinion on the appropriate alpha level to use. I see that you have used alpha=0.05 for Grubbs’ test. Several references suggest setting a lower alpha level (ie. 0.01) for outlier tests when using the same data for other statistical tests (ie 0.05). What are your thoughts on this? Thank you.
Tuba
Hello Tuba,
I haven’t thought about this before and so don’t have a strong opinion one way or the other. In general, I tend to view such tests as guidelines, and in any case, and don’t pay strict attention to the alpha value. If the statistic is low, then I suspect that there is a potential outlier and try to figure whether or not I should be concerned about it. I also tend to use other tests to see whether these give me similar information.
If you have a sample with 100 elements and one of them is 2.5 standard deviations from the mean, then this isn’t very surprising. If the sample has 20 elements, then I would take much more seriously that one is 2.5 standard deviations from the mean.
Charles
Hello Charles,
Could you please help me understand what the sig value is and why are you using it for t crit calculation instead of alpha?
Either approach should give the same result; i.e. for any statistic v, p-value < alpha is equivalent to v < v-crit (if v-crit is the left critical value or v > v-crit if v-crit is the right critical value). This is explained at
Null and Alternative Hypothesis
Charles
Thanks for the information on Grubbs’ test. I noticed that it’s said on Graphpad website: Grubb’s paper(1) gives critical values for the one-sided test, but the values in the alpha=0.025 one sided test are also for the alpha=0.05 two sided test. https://www.graphpad.com/support/faqid/1598/
Do you agree with that the alpha shoud be 0.025 in one sided test?
Thanks
For a one-tail test you need to double alpha. alpha = .05 for the two-tailed test is equivalent to alpha = .10 for the one-tailed test.
Charles
Hi, Charles. Thank you for this fantastic site. I was given a table for the Grubbs Test Critical Value, and the lowest n listed is 3. Here is the table citation: Frank E. Grubbs and Glenn Beck, “Extension of Sample Sizes and Percentage Points for Significance Tests of Outlying Observations”, Technometrics, 14(4), 847-854 (1972).
We are working with datasets that have n=4, using quarterly sampling data. In the past, Grubbs test was used for outlier testing and has been accepted by the regulating agency. Should we change to a different test due to sample size, and if so, what would be more appropriate? Thank you, Jill
Hi,
Thanks for your post.
I am trying to find out if the G critical value table uses the N sample size or the Degrees of Freedom. Calculating the values uses the DF but the table could be constructed to reference N as the sample size. I am fairly sure the N is sample size but want to check with out bothering the calculate the G critical from the formula.
I have also read that the Grubbs test should not be used on sample sizes of less than 6. Grubbs test is not reliable with these small sample sizes and leads to rejecting the Ho at an alpha where it should be accepted. You don’t state this but is that your understanding?
Joe,
There are tables of critical values for Grubbs’ test, but I don’t use them since we can use the critical values of the t distribution instead.
You are correct that the test is not reliable for small samples (as are many other statistical test). I have now updated the webpage with this fact.
Charles
Hello Mr. Zaiontz
I got a data set of n=365 and need to find out what values are outliers. Does Grubb’s test consider the max and min values only, or it can examine all of the values one by one?
Once the outlier(s) is(are) found.. Should it(they) be removed from the data set and start all over?
Pedro,
Grubbs test only finds one outlier (which or course will be the max or min, although it needs to consider all the values in determining whether one of these is an outlier). You can use the ESD extension to Grubbs test to identify more than one potential outlier.
Whether or not you remove an outlier from the data set depends on the type of test (e.g. various nonparametric tests are robust to outliers) and the reason that the data element is an outlier (i.e. if it is a measurement error or typo then it can be removed). Often you will need to run your test twice, once with the outlier included and onec without, with both results reported.
Charles
You said “data that is normally distributed (except for the outlier).”
how to know that our data is normally distributed if we don’t know the outliers yet, you said except for outliers??????????
Or is it a supposition that we do and at last we re-verify it ?
Akrour,
Yes, you can verify this assumption after you identify the outlier.
Charles
Hi Charles,
when I click on cell G12 of Grubbs’ Test, t-crit = T.INV(2*G10;G11) so cell I12 is a typo.
But if 2*G10 = 2*G8/G9 = 2*alpha/size is correct then I didn’t understand where you write …G-crit is defined as above except that the significance level for t-crit is α/(2n). Is this another typo?
Thank you in advance for your reply and for your helpful website.
Silva,
TINV(2*G10;G11) = T.INV(1-G10;G11). Note that the expression on the left is TINV and not T.INV.
Charles
Hi Charles,
I realized what the problem is. I have Excel 2010 localized in Italian so I have to pay attention to the functions names.
English localization
TINV = two-tailed inverse
T.INV = left-tailed inverse
Italian localization
INVT = left-tailed inverse
INV.T = two-tailed inverse
To me it seemed more logical T.INV = INV.T but it’s wrong.
Silva,
I understand the problem very well since I too have the Italian version of Excel on one of my computers.
Charles
Interesante lo aplicaré en mi expo.
Thanks for the information on Grubbs, and in addition I learned to evaluate data for their normal distribution characteristics .
This most kind of you.
Willie