On this webpage, we show how to use dummy variables to model categorical variables using linear regression in a way that is similar to that employed in Dichotomous Variables and the t-test. In particular, we show that hypothesis testing of the difference between means using the t-test (see Two Sample t Test with Equal Variances and Two Sample t Test with Unequal Variances) can be done by using linear regression.
Example with equal variances
Example 1: Repeat the analysis of Example 1 of Two Sample t Test with Equal Variances (comparing means from populations with equal variance) using linear regression.
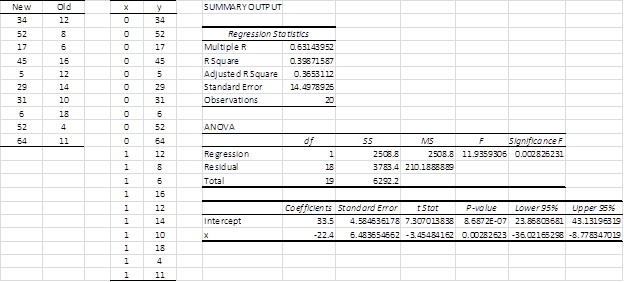
Figure 1 – Regression analysis of data in Example 1
The leftmost table in Figure 1 contains the original data from Example 1 of Two Sample t Test with Equal Variances. We define the dummy variable x so that x = 0 when the data element is from the New group and x = 1 when the data element is from the Old group. The data can now be expressed with an independent variable x and a dependent variable y as described in the middle table in Figure 1.
Running the Regression data analysis tool on x and y, we get the results on the right in Figure 1. We can now compare this with the results we obtained using the t-test data analysis tool, which we repeat here in Figure 2.
Figure 2 – t-test on data in Example 1
We now make some observations regarding this comparison:
- F = 4.738 in the regression analysis is equal to the square of the t-stat (2.177) from the t-test, which is consistent with Property 1 of F Distribution
- R Square = .208 in the regression analysis is equal to
=
where t is the t-stat from the t-test, which is consistent with the observation following Theorem 1 of One Sample Hypothesis Testing for Correlation
- The p-value = .043 from the regression analysis (called Significance F) is the same as the p-value from the t-test (called P(T<=t) two-tail).
Effect Size
We can also see from the above discussion that the regression coefficient can be expressed as a function of the t-stat using the following formula:
The impact of this is that the effect size for the t-test can be expressed in terms of the regression coefficient. The general guidelines are that r = .1 is viewed as a small effect, r = .3 as a medium effect, and r = .5 as a large effect. For Example 1, r = 0.456 which is close to .5, and so is viewed as a large effect.
Note that this formula can also be used to measure the effect size for t-tests even when the population variances are unequal (see next example) and for the case of paired samples.
Model coefficients
Also, note that the coefficients in the regression model y = bx + a can be calculated directly from the original data as follows. First, calculate the means of the data for each flavoring (new and old). The mean of the data in the new flavoring sample is 15 and the mean of the data in the old flavoring sample is 11.1. Since x = 0 for the new flavoring sample and x = 1 for the old flavoring sample, we have
![]()
This means that a = 15 and b = 11.1 – a = 11.1 – 15 = -3.9, and so the regression line is y = 15 – 3.9x, which agrees with the coefficients in Figure 1.
Unequal variance
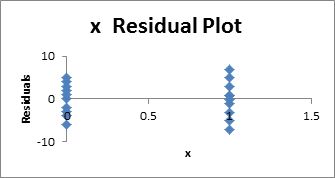
As was mentioned in the discussion following Figure 4 of Testing the Regression Line Slope, the Regression data analysis tool provides an optional Residuals Plot. The output for Example 1 is displayed in Figure 3.
Figure 3 – Residual plot for data in Example 1
From the chart, we see how the residual values corresponding to x = 0 and x = 1 are distributed about the mean of zero. The spreading about x = 1 is a bit larger than for x = 0, but the difference is quite small. This indicates that the variances for x = 0 and x = 1 are quite similar, which suggests that the variances for the New and Old samples are roughly equal.
Example with unequal variances
Example 2: Repeat the analysis of Example 2 of Two Sample t Test with Unequal Variances (comparing means from populations with unequal variance) using linear regression.
Figure 4 – Regression analysis of data in Example 2
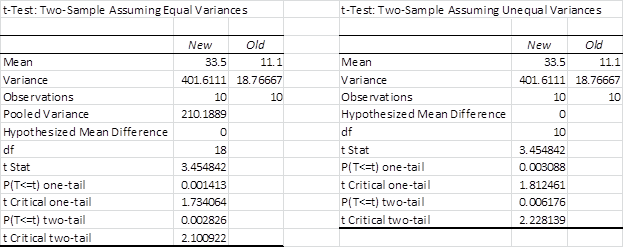
We note that the regression analysis displayed in Figure 4 agrees with the t-test analysis assuming equal variances (the table on the left of Figure 5).
Figure 5 – t-tests on data in Example 2
Unfortunately, since the variances are quite unequal, the correct results are given by the table on the right in Figure 5. This highlights the importance of the requirement that variances of the y values for each x be equal for the results of the regression analysis to be useful.
Using a residual plot
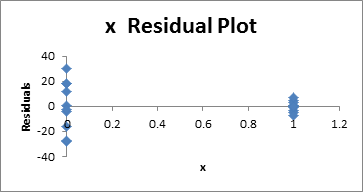
Also, note that the plot of the Residuals for the regression analysis clearly shows that the variances are unequal (see Figure 6).
Figure 6 – Residual plot for data in Example 2


Hi Charles,
Thanks very much for these examples and explanations. I’d be grateful for some advice.
I have T1 and T2 likert scale data, with T2 obtained after intervention. I am developing a scale to measure wellbeing and following principal component analysis have identified 3 factors. I then calculated 3 composite mean scores for the three factors, so, now have 3 new variables. I want to use these new variables and linear regression to show the change between T1 and T2. Can you advise how to do this?
Thanks
Eddie
Hi Eddie,
1. You need to map your original data into the values for the 3 new variables. This is done using factor scores. You then perform linear regression, in the usual way, using the data for the new variables. See
https://www.real-statistics.com/multivariate-statistics/factor-analysis/factor-scores/
2. Depending on the details, you might be able to use a paired t-test, or more likely, the multivariate version of the t-test, namely Hotelling’s T-square test, instead of regression.
Charles
Thanks very much Charles for considering my question. I will check out the reference you have cited.
Eddie
Charles, I´ve been reading your website and first I would like to thank you and congratulate for the amazing work you are doing and all the answers you provide for all us, the mortals.
I have a very particular question about comparing means (or any other central measure).
The case is the following:
Dataset: one numerical dependent variable and two categorical groups
Hypothesis: the central tendency of two groups is statistically different.
Behavior of the data: I know that the data do not follow a normal distribution, any of the two groups, they are very skew data and they don´t have the same shape. I have around 200 samples from each group.
What I have been researching: From my perspective I know I can´t perform t-test because the data doesn’t follow a normal distribution and neither a linear regression model for the same reason. I know can perform a Mann-Whitney but only tells me if the distribution are different (which they are) but I´m looking for a test that can answer me that the central tendency is statistically different.
I have read that one can use a generalized linear model to make hypothesis testing with the parameters given that your dependent variable is continuous but as far I know they use the identity function (aka the same linear regression).
My question is:
Can I use linear regression to test the parameters given I know the dependent variable doesn’t a normal distribution? and if the answer is no
Is there other test that can give me the answer if the central tendency between two different distributions is statistically different (not the answer if the shape of the distributions between the variables is different)?
Manuel,
The linear regression model is equivalent to the t test model, and so you couldn’t expect to use it if the normality assumption is not met. I am not sure what sort of generalized linear model you had in mind.
The Mann-Whitney tells you a lot more than the distributions are different. Even if the shapes of the two distributions are different, a non-significant result would tell you that if you pick one element x and y at random from each distribution, the probability that x < y is the same as the probability that y < x.
You can use bootstrapping to determine whether two distributions have different means (even if the distributions have different shapes). This topic is covered on the Real Statistics website. See Resampling.
Charles
Hello Charles, thanks in adnvace and please excuse my (amateur’s) ignorance.
I wish to run a standardized nutritional status questionnaire (MNA) by two groups of elderly folk: those living in care homes and those living in their own home but receiving healthcare visits. I’ll include some sociodemographic data to be able to compare the groups and ensure they are similar enough for comparisons to be made. The MNA gives a quantiative overall score from 18 items which is then classified into 3 strata: Malnutrition (23.5). Firstly is it correct to use an ANOVA with means contrast on the sociodemographic variables to ensure groups are comparable? Secondly, I assume I should use alinear regression and correlation but am unsre as to which type (simple, multiple, etc)… or even if it should be a T-Test… I’m a student and the more I look at it the more confusing it gets…
Hmmm , the website doesn’t like some punctuation marks…
Strata:
Malnutrition less than 17
Risk of Malnutrition 17 – 23 and a half
Normal greater than 23 and a half
Braulio,
Sorry, but I don’t have enough information to answer your question. In particular, what hypotheses are you trying to test?
Charles
Hi Charles
Can you give me the reference for the general guidelines for r (r = .1 small effect, r = .3 médium effect, r = .5 large effect)?
Many thanks
Helena
Helena,
You can find this in many places. Just google “interpreting effect size r”. Here is one such reference:
http://www.polyu.edu.hk/mm/effectsizefaqs/thresholds_for_interpreting_effect_sizes2.html
Charles
Many thanks, H
Hello Charles,
The example that you describe is between groups. Would it be appropriate to compare two means using regression with a within subjects design? All of my participants were exposed to both conditions. Can I still use the method that you described above?
Thank you
Agr,
You can use regression in this case, but I have not yet described how to do this on the website.
Charles
Charles,
similar to Agr, I am looking to compare two biological measurements taken from the same group of individuals to see the effect of tissue type on the value of this measurement. Will you be describing how one sets up a regression when observations are not independent any time soon? This would be immensely helpful.
Thanks for the clear and detailed explanations you’ve already provided above.
Elisabeth
Elsabeth,
I understood that Agr was looking to perform a version of repeated measures ANOVA using regression.
The website describes how to perform repeated measures ANOVA. See the following webpage:
Repeated Measures ANOVA
I still plan to develop a method which uses regression to provide a more robust solution.
Charles
Charles my study have four independet variable and one dependent varible iwant to use linear regression method for analysis but the problem is the sample size which will give the acceptable r-square value for generalizations of my findings
January,
You can use the Real Statistics Statistical Power and Sample Size data analysis tool to calculate the sample size necessary for your regression analysis based on the expected effect size (i.e. R-square) value. See the following webpage for more details
Sample Size Regression
Charles
So we could also use regression analysis if only if the two groups have the same variance? Correct me if I’m wrong. Thanks
You can use the t test (with equal variances) as long as the variances are not too different. If not you can use the t test with unequal variances. The t tests work even with moderate violations of the normality assumption. The regression approach, as described on the website, is equivalent to the t test (as explained at https://real-statistics.com/regression/linear-regression-models-for-comparing-means/). If the normality assumption is severely violated (esp. if the data is clearly unsymmetric), then the Mann-Whitney test is probably your best choice.
Charles