Basic Approach
In ordinary linear regression, the yi values are estimated from the xi values with error ɛi. In Deming regression, it is assumed that also the xi values are estimated with error, which we will denote δi.
We further assume that the ɛi and δi errors are independent of each other and both are distributed normally with a mean of zero. The variance of the ɛi values is denoted σ2 and the variance of the δi values is τ2.
The regression model now takes the form
![]()
where β0 and β1 are the intercept and slope coefficients and ŷi and 
Variances
If the values of σ2 and τ2 are known then we use σ2 and τ2 as the variances of the ɛi and δi errors. If they are not known then we must have multiple estimates of the x and y values. Assuming that for each i we have ki estimates for the xi and mi estimates for the yi, then for each i, we can estimate xi as the mean of these ki estimates xij and yi as the mean of these mi estimates yij, i.e.
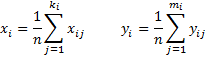
where n is the sample size. Note that ki > 1 and mi > 1 , but ki can be different from mi.
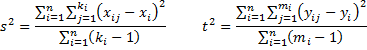
We can also estimate the values of σ2 and τ2 by
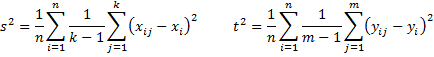
Note if all the ki are equal (say to k) and all the mi are equal (say to m), then each estimate of the variance is equal to the average of the row variances, i.e.
Property
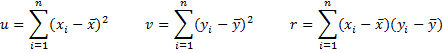
Property 1: If λ = s2/t2, then the estimates of the coefficients that minimize the Deming sum of squares

are given by![]()
![]()
where x̄ and ȳ are the means of the xi and yi values respectively, and
Note: In some references, λ is defined as the reciprocal of the value shown in Property 1.
Definitions
Definition 1: The estimated true values for the xi and yi are then calculated by
![]()
where the ei are the (raw) residuals
![]()
Definition 2: In addition to the raw residuals defined above, there are the following additional types of residuals:
![]()
![]()
![]()
Example (known variances)
Example 1: Find the Deming regression equation for the data in columns A, B, and C of Figure 1. Here the variance of the measurements for the x values is known to be .05 and the variance for the y values is known to be .02.
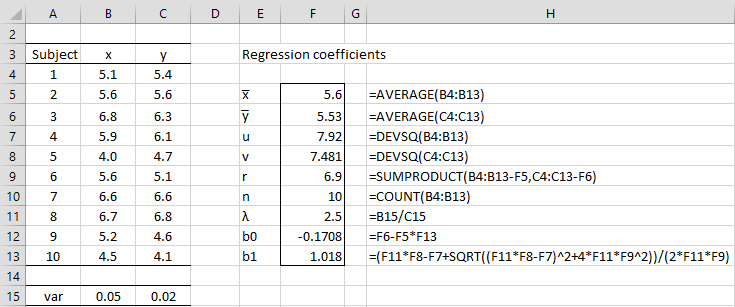
Figure 1 – Calculation of regression coefficients
Using the formulas described above we see that the regression formula is
y = -.1708 +1.018x
We can characterize the sample data and residuals as described in Figure 2 using the formulas in Definitions 1 and 2.
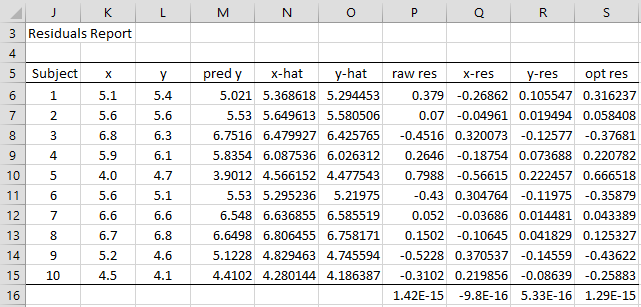
Figure 2 – Residuals Report
For example, the formula in cell M6 is =F$12+K6*F$13 (referring to Figure 1), the formula in cell P6 is =L6-M6, the formula in cell N6 is =K6+$F$11*$F$13*P6/($F$11*$F$13^2+1), and the formula in cell O6 is =L6-P6/($F$11*$F$13^2+1). The formula shown in cell Q6 is =K6-N6, the formula in cell R6 is =L6-N6, and, finally, the formula in cell S6 is =SIGN(P6)*SQRT(Q6^2+$F$11*R6^2).
Note, further, that the means of these residuals (as shown in row 16) are all close to zero, as expected.
Testing Residuals for Normality
One of the assumptions for Deming regression is that the residuals are normally distributed. We test the optimized residuals (range P6:P15) for normality using a QQ plot and Shapiro-Wilk, as shown in Figure 3. Both tests confirm that the residuals are normality distributed.
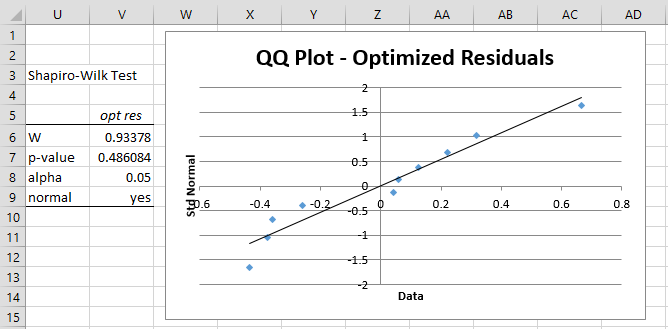
Figure 3 – Testing optimized residuals for normality
Example (unknown variances)
Example 2: Find the Deming regression equation for the data in Figure 4.

Figure 4 – Deming Regression Data
This time note that there are 3 measurements for each x value and 2 measurements for each y value. We, therefore need to calculate the x and y variances for each subject in order to calculate lambda. In order to carry out the Deming regression, we also need to take the mean of the x and y measurements for each subject. This is shown on the left side of Figure 5.
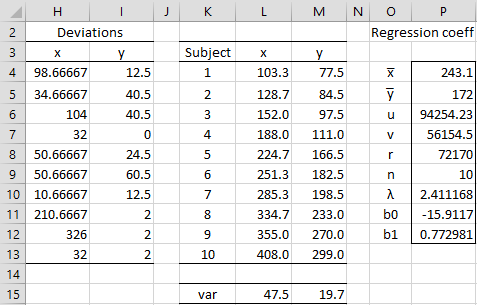
Figure 5 – Deming regression
For example, cell H4 contains the formula =DEVSQ(B4:D4), cell I4 contains =DEVSQ(E4:F4), cell L4 contains =AVERAGE(B4:D4), and cell M4 contains the formula =AVERAGE(E4:F4).
Cells L15 and M15 contain the variances for x and y values, as calculated by the worksheet formulas =SUM(H4:H13)/(COUNT(B4:D13)-A13) and =SUM(I4:I13)/(COUNT(E4:F13)-A13). The value of lambda shown in cell P10 is calculated as 47.5/19.7 = 2.411168.
Using the data in columns K, L, and M we can calculate the regression coefficients exactly as we did in Example 1. The regression equation is y = -15.9117 + .772981x.
Worksheet Functions
Real Statistics Functions: For array or range R1 containing X values and R2 containing y values, we have two forms of the following two array functions. The first version of each corresponds to data as in Example 1 where lambda is known and the second where lambda is calculated from the data as in Example 2.
DRegCoeff(R1, R2, λ, lab) = 2 × 2 array consisting of the intercept and slope coefficients and standard errors for Deming regression on the data in R1 and R2 where lambda = λ.
DRegCoeff(R1, R2,, lab) = DRegCoeff(R3, R4, λ, lab) where R3 consists of the averages of the X data measurements in R1, R4 consists of the averages of the Y data measurements in R2 and the λ is calculated as in Example 2.
DRegResiduals(R1, R2, λ, lab) = n × 7 array consisting of pred y, x-hat, y-hat, raw residual, x-residual, y-residual and optimized residual for each pair of data elements in R1 and R2 based on the Deming regression on the data in R1 and R2 where lambda = λ and n = the number of elements in R1 (or R2). It is assumed that R1 and R2 are column arrays.
DRegResiduals(R1, R2,, lab) = DRegResiduals(R3, R4, λ, lab) where R3 consists of the averages of the X data measurements in R1, R4 consists of the averages of the Y data measurements in R2 and the λ is calculated as in Example 2.
If lab = TRUE (default FALSE), then an extra column is appended to the output from DRegCoeff containing the labels “intercept” and “slope”. Similarly, If lab = TRUE (default FALSE), then an extra row is appended to the output from DRegResiduals with the labels shown in range M5:S5 of Figure 2.
Non-array function
In addition, we have the following non-array function:
DRegLambda(R1, R2) = the lambda value calculated from R1 and R2 as described in Example 2.
Note that for Example 1, the array formula =DRegCoeff(B4:B13, C4:C13, 2.5) produces the coefficients shown in F12:F13 of Figure 1. For Example 2, =DRegCoeff(B4:D13, E4:F13) produces the coefficients shown in P11:P12 of Figure 5. Also for Example 2, =DRegLambda(B4:D13, E4:F13) produces the result shown in cell P10 of Figure 5.
For Example 1, =DRegResiduals(B4:B13, C4:C13, 2.5, TRUE) produces the output shown in range M5:S15 of Figure 2.
Conclusion
We have now shown how to calculate the regression coefficients in the case where the measurement variances are known (Example 1) and when they need to be estimated from the data (Example 2). See Jackknifing for how to calculate the standard error of these coefficients by using a technique called jackknifing.
Examples Workbook
Click here to download the Excel workbook with the examples described on this webpage.
References
NCSS (2016) Deming regression
https://www.ncss.com/wp-content/themes/ncss/pdf/Procedures/NCSS/Deming_Regression.pdf
Tellinghuisen, J. (2020) Least squares methods for treating problems with uncertainty in x and y. Anal. Chem. 2020, 92, 16, 10863–10871
https://pubmed.ncbi.nlm.nih.gov/32678579/
Mandel, J. (2018) Fitting Straight Lines When Both Variables are Subject to Error
https://www.tandfonline.com/doi/abs/10.1080/00224065.1984.11978881
Dear Charles, I hope you and your family are ok. Please i am doing Demkin Revgression, but the resoult are:
Deming Regression
alpha 0,05
coeff std err df t stat p-value lower upper
#¡VALOR! #¡VALOR! #¡VALOR! 9 #¡VALOR! #¡VALOR! #¡VALOR! #¡VALOR!
#¡VALOR! #¡VALOR! #¡VALOR! 9 #¡VALOR! #¡VALOR! #¡VALOR! #¡VALOR!
Hypothesis Testing
alpha 0,025
test param std err df t stat p-value lower upper
slope = 1 #¡VALOR! #¡VALOR! 9 #¡VALOR! #¡VALOR! #¡VALOR! #¡VALOR!
identity #¡VALOR! #¡VALOR! 9 #¡VALOR! #¡VALOR! #¡VALOR! #¡VALOR!
coeff std err df t stat p-value lower upper
#¡VALOR! #¡VALOR! #¡VALOR! 9 #¡VALOR! #¡VALOR! #¡VALOR! #¡VALOR!
#¡VALOR! #¡VALOR! #¡VALOR! 9 #¡VALOR! #¡VALOR! #¡VALOR! #¡VALOR!
Please help me.
Thanks
Excuseme, I have had an error.Thanks
Hello Gerardo,
We are all doing well. I hope that you and your family are ok as well.
If you are getting error values, please send me an Excel file with your data so that I can try to figure what is causing the error.
Charles
I’m trying to understand how the variance is determined for the x and y variables in figure 5. I can’t seem to duplicate the values that are generated in the example.
Hello Blair,
Have you downloaded the Excel spreadsheet containing the example described on the webpage? This spreadsheet should explain the calculations. You can click on the link towards the bottom of the webpage.
Charles
Thanks Charles
Dr. Zaiontz,
thanks for the tutorial and detailed illustration. I am wondering how b0 and b1 can be calculated in Fig 1 without doing minimization (such as using the Solver in excel)?
Hi Tony,
Probably so. I have used Solver for many types of regression, as illustrated elsewhere on this website, but haven’t tried it for Deming Regression.
Charles
Dr. Zaiontz,
sorry for not being clear in my question, my question was why the fig 1 calculation does not appear to require a minimization step? I don’t mean it has to be Solver. My question was why there was no minimization step in Fig 1 when b0 and b1 are calculated. shouldn’t a regression always look for a pair of b0 and b1 that minimizes the summed deviations?
thanks
Dear Sirs
There is one more small error in line below this
“We can also estimate the values of σ2 and τ2 by” line 25 approximately
you are replacing σ2 by s2 and τ2 by t2, i have also sent a mail for the same.
rgds
abrar
Hello Abrar,
Sorry, but I don’t understand what the error is. Sigma squared is indeed estimated by s squared.
Charles
‘We can also estimate the values of σ2 and τ2 by’
In this line you define σ2 and τ2
below line above you write as s-square s2 intead of σ2, it is there just concentrate a bit.
rgds
abrar
Sorry, but I don’t understand your comment. sigma-squared is the population parameter, while s-square is the sample statistic used as an estimate of sigma-squared.
Charles
Dear Sirs Thanks for such a real explanation for Demming Regression, however there seem to be some typos as in these two lines ……
Note, further, that the mean of these residuals are all close to zero (see row 30), as expected.
test the optimized residuals (range P20:P29) for normality using a QQ plot and Shapiro-Wilk, as
where is row 30
where is range P20:P29
Kindly clarify
Thank you for bringing these typos to my attention.
I have just corrected the webpage
row 30 => row 16
range P20:P29 => P4:P15
I appreciate your help in improving the quality of the Real Statistics website.
Charles
Thanks a lot, your work is superb, some, i think you should have typed P6-P15 instead of P4:P15, but it is now meaningful, i think you should correct it for new commers leave sites if they see any error.
Yes, it has been corrected to P6:P15.
Charles
Dear Charles,
I was struggling to understand how deming regression works, but when I found this page it took about an hour.
Thank you very much for you wonderful webpage!
-Elias
Hello Elias,
Glad that I could help.
Charles
Dear Charles, good morning!
Have you ever thought about turning your website into a book? I would buy! I learned more about some Statistics topics from you than from other teachers! You are extremely didactic!
A big hug from Brazil, Igor
Igor,
Thank you for your very kind words and for your suggestion.
I originally wrote the website as a book and planned to publish it, but ultimately I decided against it since I was constantly updating it and adding content, something I couldn’t do with a book.
Charles
Charles,
Thank you very much for your webpage and your package, I found it very useful!
I have one question, just to be sure. When I use the Deming regression tool in Excel, lambda is defined as the quotient of s2/t2 as in this page?
I ask because in Saylor et al, 2006, they define the quotient as t2/s2.
My results using your package seem more compatible with your definition, but I need to make sure. Which reference do you suggest to check the formulas (in addition of the obscure book by Deming itself)?
Cheers,
Julian
Saylor, R., Edgerton, E., & Hartsell, B. (2006). Linear regression techniques for use in the EC tracer method of secondary organic aerosol estimation. Atmospheric Environment, 40(39), 7546–7556. https://doi.org/10.1016/j.atmosenv.2006.07.018
Hello Julian,
I am using the following reference:
NCSS (2016) Deming regression
https://ncss-wpengine.netdna-ssl.com/wp-content/themes/ncss/pdf/Procedures/NCSS/Deming_Regression.pdf
Charles
Dear Charles,
For comparison’s reason, I’m looking for some kind of “coefficient of determination” to serve as an analogy for the least squares R2.
Which formula can be used to calculate R2 for the Deming regression?
Thank you in advance!
Kind regards,
Andreas
Dear Andreas,
See
https://www.stata.com/statalist/archive/2008-10/msg00284.html
https://www.graphpad.com/guides/prism/latest/curve-fitting/reg_qa_deming_regression.htm
Charles
Dear Charles,
Thank you very much! You helped me a lot.
Kind regards,
Andreas
how to calculate variance error if we have dataset like example 1
How to do this is described at the end of this webpage or see
Jackknifing
Charles
Hi there,
In simple Deming regression, how did we find var values as 0,05 and 0,02? Can you describe?
Mehmet,
It is not stated where these values come from. You can consider them to be assumptions. In reality, they probably came from previous testing.
Charles
Please correct: The formula shown in cell Q6 is =K20-N6, the formula in cell R6 is =L20-N6
should be:
The formula shown in cell Q6 is =K6-N6, the formula in cell R6 is =L6-O6
Suggestion: Why not shift fig.2 two lines up, so that it would align with fig.1 (i.e., “Subect” would b in line 3 in both figures)?
Hello JMS,
Thanks for identifying these two typos. I have now made the corrections that you suggested.
I don’t quite understand what shifting Fig 2 up to lines does.
Charles
“I don’t quite understand what shifting Fig 2 up to lines does.”
Nothing! Just keeps corresponding things in the same line of the sheet. Ex.: Subject1 is in line 4 of fig.1 and in line 6 of fig, 2. If you put the information os bothe figures side by side in the same sheet, the alignment of both sections will make it more readable.
Ok. Thanks for the explanation. I will look into this.
Charles
Should the λ be τ2 in the fourth paragraph?
“If the values of σ2 and λ are known then we use σ2 and τ2 as the variances of ɛi and δi errors. If they are not known then we must have multiple estimates of the x and y values. Assuming that for each i we have ki estimates for the xi and mi estimates for the yi, then for each i, we can estimate xi as the mean of these ki estimates xij and yi as the mean of these mi estimates yij, i.e.”
Nevermind – figured out my error.
Another of those sophisticated topic well elucidated. Thanks very much.
Hello Dr. Zaiontz,
I am trying to perform regression analysis for my data, where the x values have a known error that is not constant across the whole range. Can Deming regression still be applied in this case, or if not what analysis is more appropriate?
Thank you.
Sabrina,
Deming regression requires homogeneity of variances for each of the two types of errors.
I don’t know how to modify Deming regression when this assumption is not met.
Charles
Well done Sir.
Have you published something with such detail for a nonlinear model? Implicit model?
Hazem,
No, but if you look at the following webpage you can see how to perform nonlinear regression.
https://real-statistics.com/regression/exponential-regression-models/exponential-regression-using-solver/
Charles