Basic Concepts
Definition 1: Under the same assumptions as for the binomial distribution, from a population of size m of which k are successes, a sample of size n is drawn. Let x be a random variable whose value is the number of successes in the sample. The probability density function (pdf) for x, called the hypergeometric distribution, is given by
![]()
Let p = k/m. Then the situation is the same as for the binomial distribution B(n, p) except that in the binomial case after each trial the selection (whether success or failure) is put back in the population, while in the hypergeometric case, the selection is not put back and so can’t be drawn again. When n is large the hypergeometric and binomial distributions yield more or less the same result, but this is not necessarily true for small samples.
Key statistical properties of the hypergeometric distribution are:

Figure 1 – Hypergeometric distribution properties
Worksheet Functions
Excel Functions: Excel provides the following function:
HYPGEOM.DIST(x, n, k, m, cum) = the probability of getting x successes from a sample of size n, where the size of the population is m of which k are successes (i.e. the pdf of the hypergeometric distribution) if cum = FALSE and the probability of getting at most x successes from a sample of size n (i.e. the cdf of the hypergeometric distribution) if cum = TRUE.
This worksheet function is not available in versions of Excel prior to Excel 2010. Instead, these versions of Excel use the worksheet function HYPGEOMDIST(x, n, k, m), which is equivalent to HYPGEOM.DIST(x, n, k, m, FALSE).
Real Statistics Function: Excel doesn’t provide a worksheet function for the inverse of the hypergeometric distribution. Instead, you can use the following function provided by the Real Statistics Resource Pack.
HYPGEOM_INV(p, n, k, m) = smallest integer x such that HYPGEOM.DIST(x, n, k, m, TRUE) ≥ p.
Note that the maximum value of x is n. A value higher than n produces an error. This function is only available for users of Excel 2010 or later.
Properties
Since
![]()
it follows that
HYPGEOM.DIST(p, n, k, m, cum) = HYPGEOM.DIST(p, k, n, m, cum)
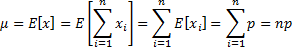
Property 1: The mean of the hypergeometric distribution, as described above, is np where p = k/m.
Proof: For i = 1, …, n, let xi be the random variable such that xi = 1 if the ith sample element drawn is a success and 0 if it is a failure. Since the mean of each xi is p and x = 
Examples
Example 1: A bag contains 12 balls, 8 red and 4 blue. You reach into the bag and pick 3 balls at random (without replacement). What is the probability that at least 2 of the balls will be blue?
In this context, at least 2 blue balls means 2 or 3 blue balls and so the answer is 23.6%, calculated as follows:
= HYPGEOM.DIST(2, 3, 4, 12, FALSE) + HYPGEOM.DIST(3, 3, 4, 12, FALSE)
= .218 + .018 = .236
You can also calculate the answer as follows:
1 – HYPGEOM.DIST(1, 3, 4, 12, TRUE) = .236
Example 2: Mary and Jane both attend the same university, but don’t know each other. Each has about 200 friends at the university. Assuming that each of these groups of friends represents a random sample from the 50,000 students who attend the university, what is the probability that Mary and Jane will have at least one friend in common?
This problem is equivalent to picking 200 balls at random (representing Mary’s friends) from a bag containing 49,998 balls (representing the 50,000 students less Mary and Jane), 200 of which are blue (representing Jane’s friends), and getting at least one blue ball. We first calculate the probability that none of the balls will be blue as follows:
HYPGEOM.DIST(0, 200, 200, 49998, FALSE) = .448
Thus the answer is 1 – .448 = 55.2%.
More examples
Example 3: A warehouse contains 500 used computers. A random sample of 100 of these is tested and three of them are found to be defective. What is the most likely percentage of defective computers in the warehouse?
In this problem x = 3, n = 100, and m = 500. We seek the value of k which maximizes the value of HYPGEOM.DIST(x, n, k, m, FALSE), i.e. the maximum likelihood estimate for k. We create the table in Figure 2 with the value of k from 0 to 500.
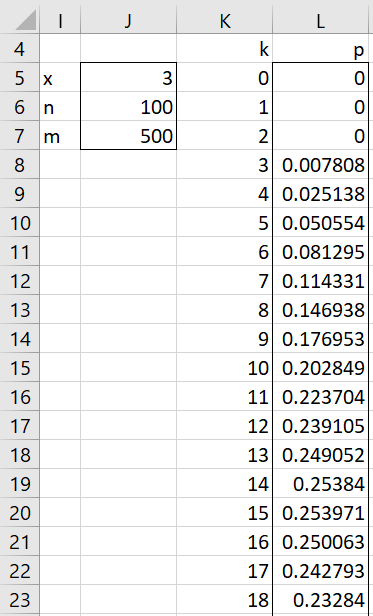
Figure 2 – Maximum likelihood estimate for # of defects
We only need to display the beginning of the table to see that k = 15 yields the highest probability with p = .253971.
Example 4: A manufacturer produces shirts in batches of 3,000. They decide to sample 50 shirts from each batch and count the number of defective shirts in each sample. If they want to make sure that 99.5% of the batches have no more than 20 defects, what is the maximum number of defects that they should allow in each sample?
The answer is given by
HYPGEOM_INV(.995, 50, 20, 3000) = 2
Examples Workbook
Click here to download the Excel workbook with the examples described on this webpage.
References
Wikipedia (2012) Hypergeometric distribution
https://en.wikipedia.org/wiki/Hypergeometric_distribution
Forbes, C. Evans, M, Hastings, N., Peacock, B. (2011) Statistical distributions. 4th Ed, Wiley
https://www.wiley.com/en-us/Statistical+Distributions%2C+4th+Edition-p-9780470390634
Hi, when using the hyper geometric distribution for lottery probability in excel would the equation be:
HYPGEODIST(2,6,6,47) – if I wanted to work out the probability of selecting 2 balls correctly, out of 6 drawn, if there were 47 numbers in that lottery?
Equally – if I them wanted to find the probability of selection 2 balls correctly out of 3 independent draws of the lottery, would the equation be:
HYPGEODIST(2,18,18, 141)?
Carey,
The first formula looks correct, assuming that you want exactly two balls to be correct (and not at least two balls to be correct).
The second formula also looks correct if I am interpreting the question the same way as you are.
Charles
Hi Charles,
Thank you so much for your reply, I really appreciate it!
What would the formula be if I wanted at least 2 balls to be correct out of the 6 drawn?
The second formula HYPGEODIST(2,18,18, 141) was trying to work out the probability of choosing 2 balls correctly from three different lottery draws. For example, if a lottery with 6 balls drawn out of 47, had three separate draws in one night, what is the probability of selecting 2 correct across the 3 independent draws.
Thank you!
Carey,
1. At least 2 out of 6 is the complement of at most 1 out of 6. Thus, if E = the event of at least 2 out of 6, then the complement E’ = at most 1 out of 6. Thus P(E) = 1 – P(E’), but P(E’) can be obtained from the Excel HYPGEOM.DIST(…,TRUE)
2. The probability of three independent events is the product of the probabilities. The probability of each of these events id the probability of 2 correct draws out of 6.
Charles
Hi Charles,
How can I check if responses are significant for the following question if I would like to know the significant difference between 55% selected 24-25 years vs. 45% selected 26-27 years amongst those who responded “yes”:
If yes, then how old? 24 years, 25 years, 26 years, 27 years.
Sorry, but I don’t understand your question.
Charles
Hello Mr. Zaiontz!
If you flip a deck of 52 cards while saying aloud “Ace, 2,3,4 etc”, what are the odds/how do you calculate the odds of not matching any of the 52 cards?
A,2,3,4,5,6,7,8,9,10,J,Q,K,
then again A,2,3,4,5,6,7,8,9,10,J,Q,K,
again A,2,3,4,5,6,7,8,9,10,J,Q,K,
finally A,2,3,4,5,6,7,8,9,10,J,Q,K
What are the odds for each card to match?
I know that the odds of flipping an Ace on the first card is 1/13 (4/52) but what are the odds that 2 is the next card (assuming the first card is not reshuffled back into the deck)?
What are the odds that the 3rd card is a 3 (and that the other 2 were not Ace, or 2)?
How about the odds of the 4th card being a 4? (and so on)
Thank you so much!
Peter
Peter,
Let me answer a related question since it may be helpful: What are the odds that when you select two cards, the first card is not an Ace and the second card is not a 2?
The odds that the first card is not an Ace and the second card is not a 2 are 44/52 * 47/51 + 4/52 * 48/51. Here, in the first part of the sum, 44/52 represents not getting an Ace or 2 on the first card and the 47/51 represents not getting a two on the second card. In the second part of the sum, the 4/52 represents getting a 2 on the first card (which is not an Ace) and the 48/51 represents not getting a 2 on the second card.
Charles
Hey Charles,
I apologize if the answer to this is clearly in this article. I am MD with a very rusty BS in math. Working on a project with the following numbers,…
Breakage (Y) (N)
Pop 1. 1 11
Pop 2 4 10
Using the hypgeomdist functions like you displayed, I get a value of 0.213. I am struggling to calculate the two tailed version of this (I think I’m loosing you at what values to use that are 0.05). Additionally I came across another resource that seems to demonstrate another way to calculate the t-test, using 2*min(hypgeomdist) for all of the values less than or equal to the variable_s, in my instance 1, for your example 2. http://www.kmpk.ugm.ac.id/images/Semester_1/Biostatistik/SG%20Appendix.pdf
Any help of course is much appreciated. This has been my go to for some time now.
Hello Marguerite,
The examples on the webpage calculate a probability. There are no one-tailed and two-tailed versions.
What test are you trying to do?
Charles
Hi charles !
I’ve a question about calculating a cumulative multivariate hypergeometric distribution.
For exemple, Poputaion size is M, sample size is n, population success are k1 and k2 and sample success are x1 and x2.
(k1 C x1) (k2 C x2) (N-k1-k2 C n-x1-x2)
P(x1,x2) = —————————————————
(N C n)
It works great for fixed values like x1 = 1 and x2 = 1 for exemple.
Now if I want the probalities of 1<= x1 <= 3 and 1<= x2 <= 2, is the only way is to calculate P(1,1) + P(1,2) + P(2,1) + P(2,2) + P(3,1) + P(3,2) ?
Because the bigger the success range are and the more the number of different population success there are, it becomes quickly overhelming.
Or there's a shortcut do do these calculations ?
Sorry for my english and thanks a lot !
Hello Max,
In general, if the discrete cumulative probability function for a function is F(x) = P(y: y <= x) then P(y: x1 <= y <= x2) = F(x2) - F(x1-1). You can therefore use HYPGEOM.DIST(x, n, k, m, TRUE). THings get a little more complicated when there are two variables instead of one. Charles
If I have a box with two-hundred-thousand marbles and only one is red, how do I calculate the probability that I will draw the red one out four times consecutively?
This problem is similar to Example 1.
Charles
You don’t need the hypergeometric distribution for this calculation. It will be (1/200,000)^4
Hi Charles,
I see it’s been quiet here a while, but hoping you might be able to help answer a question.
I’m looking to calculate, as an example, the probability of getting a particular hand in 5-card draw Poker – say, a full house of two Aces and three Kings.
I know that to calculate the probability of independently drawing the two Aces in a five-card had I would need to use =HYPGEOM.DIST(2,5,4,52,FALSE), and for the three Kings it would be =HYPGEOM.DIST(3,5,4,52,FALSE). For two Aces AND three Kings in the same 5 card hand do I simply calculate them separately (for instance as the probability of getting two Aces from a two-card draw and getting three Kings from a three-card draw) and then multiply the result together, or do I need to alter the population size to account for “known” results in one or both of the calculations (population size set to 50 or 49, respectively)?
This example is as close to the actual application as is feasible to explain, but you could also look at is as simply achieving multiple exclusive conditions in the one sample, i.e. the chance of of pulling exactly two red and one blue ball from the bag of twelve balls, to reference your own example.
I hope that makes sense!
Thanks in advance,
James.
Hi James,
Since the events are not independent you can’t simply multiply the two probabilities.
The problem is similar to pulling 5 balls out of a bag that contains 4 red, 4 blue and 44 green, without replacement, and getting 3 red and 2 blue balls.
The answer is C(4,3) x C(4,2) / C(52,5). This is because there are C(4,3) = 4 ways to pick the 3 or 4 kings and C(4,2) = 6 ways to pick 2 of 4 aces out of C(52,5) = 2,598,960 5-card hands. The probability is therefore 24/2598960. See https://stattrek.com/poker/probability-of-equal-rank-cards.aspx for more details.
Charles
MY DOUBTS ARE SOLVED ,THANK YOU CHARLES
Hi Charles,
I’m trying to use a hypergeometric distribution to analyze protein expression data with the goal of determining if any classes of proteins are over-enriched in one of 20 subsets (based on similarity of expression profile). The sets range in size from 10-730. There are 1,500 proteins in total and 40 different ‘classes’ assigned to proteins, many of which have multiple classes assigned. The frequency of the classes in the data set ranges from 2 to 800.
Now, I have a pretty easy time setting up the Hypgeom.dist function in excel and deriving P-values for all of my different classes in all of my different sets so I can determine if any particular class is over-or-under-enriched in a set, but what I’m having a hard time grasping is whether or not I need to apply any sort of multiple testing correction. Would a Bonferroni correction be appropriate? I’ve attempted to apply one to my P-values and they all become insignificant (Which may be the case!!) Can you please help me determine whether or not a multiple testing correction is necessary, and if so, which would be correct for a data set on the scale I described?
Thanks for the great excel package.
David,
Since I don’t understand your scenario, I can’t comment on how you could use fewer tests (if indeed that is possible). But if you use multiple tests, you need to take this into account. The Bonferroni correction is one way to do this.
Glad you like the Real Statistics package.
Charles
So I built a spreadsheet for this years ago and it worked but now I can’t seem to get formula correct.
I play MTG and sometimes I optimize my mana base or what not using this function.
In my example I need to know the likekly hood of drawing at least 3 lands. I’m using autofill to figure at what point it is 100%.
The numbers are as follows: 3 lands, 7 drawn, total 40 lands, total 98 cards.
Currently I have =1-HYPGEOM.DIST(3,7,40,98,TRUE) is this the correctly formula?
Also does the pool size (total cards) change as cards drawn increases?
My formula is actually like below
=1-HYPGEOM.DIST(B2,C2,D2,E2-(row()-2),TRUE) thus decreasing total cards by 1 in each row.
Sorry, but I don’t understand the situation that you are describing. What is MTG and what are the meanings of lands, etc.?
Charles
Charles,
I believe MTG is Magic the Gathering.
Coleman984,
When you say you can’t seem to get the correct formula, what do you mean? From what I can tell, I think your first argument needs to be 2 instead of 3. In other words, the probability of drawing 3 or more lands is equal to 1 minus the probability that you are drawing 2 or fewer land cards in a hand of 7 cards.
Regarding your other questions, I don’t believe the total changes unless you somehow add or take cards from your deck, or unless you are drawing a different number of cards. So maybe if you have a hand of seven cards, and you play one, and draw from your deck which is now 98-7=91 cards, you would need to recalculate. In this case, if you are going to draw 1 card and you wanted to know the probability that your new hand will include 3 or more lands, it would be conditional on both the number lands you are presently holding, and the probability that your next single card is a land.
As for at what point your probability is 100%, it seems to me that would be when you have included all of your possible outcomes, conditional on any restrictions that may apply to your deck (e.g. Pr(X>=0) or Pr(X<=7)).
I hope this helps.
318 people were admitted to the ICU. 77 of which were selected to an isolation wing, The rest were placed in a regular wing. Of the 77 who were isolated 8 (10%) were found to harbour a resistant bug. Among the 231 who were not isolated, 14 (5.8%) were found to harbour the bug. Did the selection criteria work?
What are the are the arguments for the Excel Hypergeometric function?
Are they (8, 77, 14, 231) or (8, 77, 22, 318). This is not clear, since the CDC Epi Info software, requires the first set, but does not accept such large numbers. Thanks
Aviel,
The Excel function uses the (8, 77, 22, 318).
Note that 77+231 is not equal to 318
Note too that you can use the chi-square test or the Fisher exact test to determine whether isolation makes a significant difference.
Charles
Ok I’m trying something and I’m not sure if I did it correctly.
I want to know the chances of getting 6 Red balls, with 14 pulled out randomly, there are a total of 30 red balls, and a total of 100 balls.
I tried:
=HYPGEOMDIST(A2, B2, C2, D2) + HYPGEOMDIST(B2, B2, C2, D2)
=HYPGEOMDIST(6, 14, 30, 100) + HYPGEOMDIST(14, 14, 30, 100)
Where:
A2 = 6
B2 = 14
C2 = 30
D2 = 100
If you want exactly 6 red balls then the answer is =HYPGEOMDIST(6,14,30,100) or =HYPGEOM.DIST(6,14,30,100,FALSE). If you want at least 6 red balls then the answer is =HYPGEOM.DIST(6,14,30,100,TRUE).
Charles
Thanks! I just didn’t think the numbers could be correct I think. But looks like they are correct.
should it be =1-(hypgeomdist(6,14,30,100,true) if I wanted to see it as a percentage?
Oops. I believe that I made a mistake. If you want at most 6 red balls then the answer is =HYPGEOM.DIST(6,14,30,100,TRUE). If you want at least 6 red balls the answer is =1-HYPGEOM.DIST(5,14,30,100,TRUE). If you want it as a percentage just use the percentage format or simply multiply your answer by 100.
Charles
I should know I don’t want to know the probability of getting exactly 6 red balls. I want to know the probability of getting AT LEAST 6 red balls. Quite different.
Hi Charles,
thanks a lot for the great website and all the work you are putting into it. I think Example 1 contains an error “.218 + .018 = .326” should say “.218 + .018 = .236” instead.
Dirk
Hi Dirk,
Thanks for catching this typo. Looks like my dyslexia kicked in. I have now corrected the referenced webpage. Your help is most appreciated.
Charles
Good day!
Sir, how about the excel calculation for 2F1(a,b;c;z) where a=0.5, b=5.5, c=1.5, and z=-0.62956. Might there be a workaround for me to use the HYPGEOMDIST function? Many thanks.
Abel,
Sorry, but I don’t know how to calculate the hypergeometric function from the hypergeometric distribution.
Charles