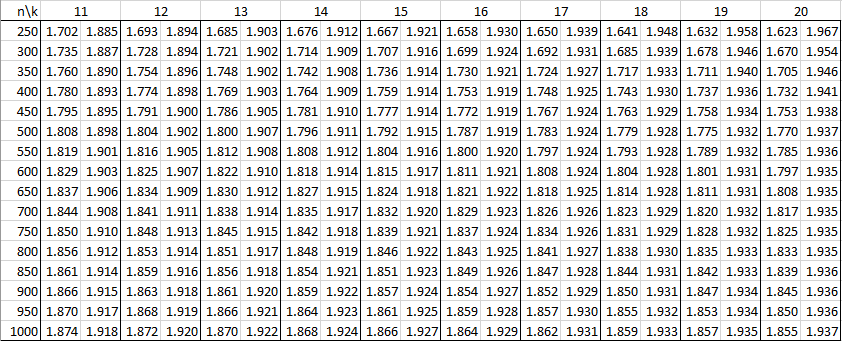
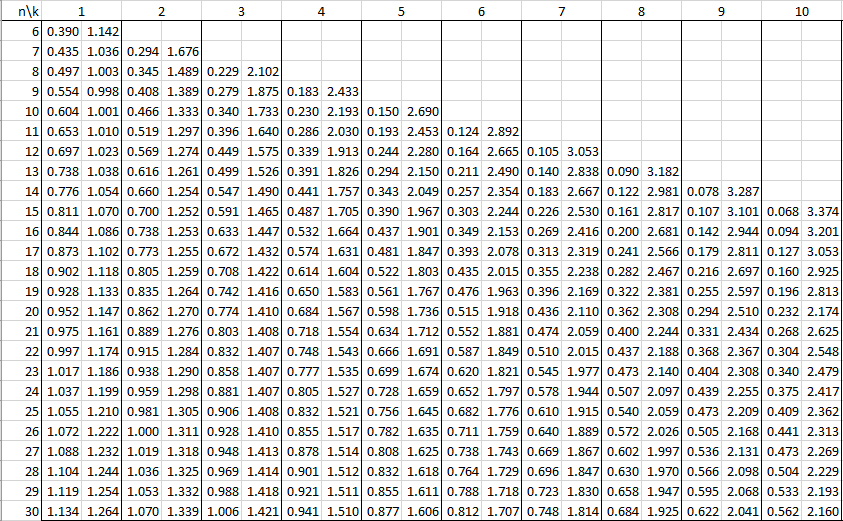
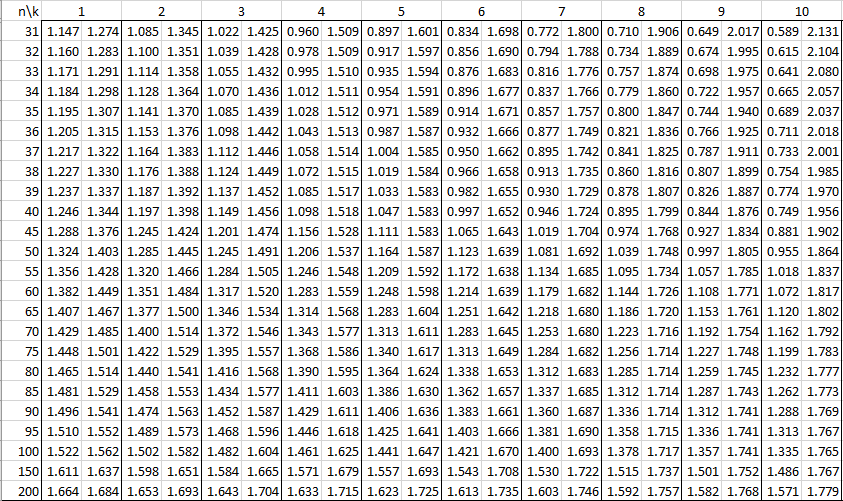
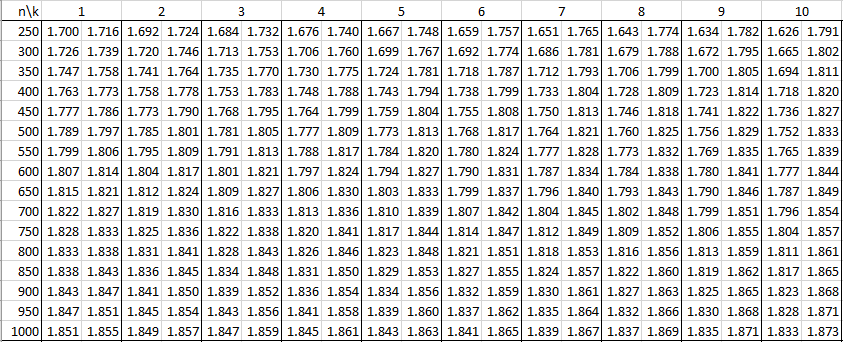
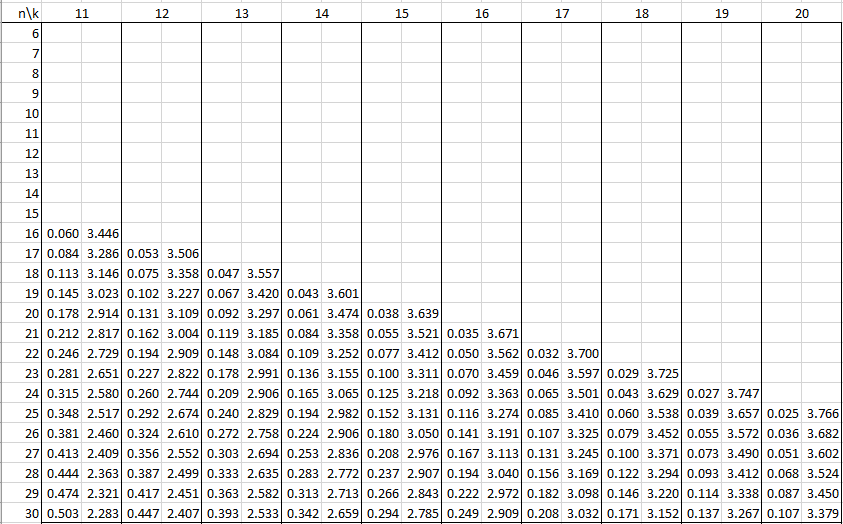
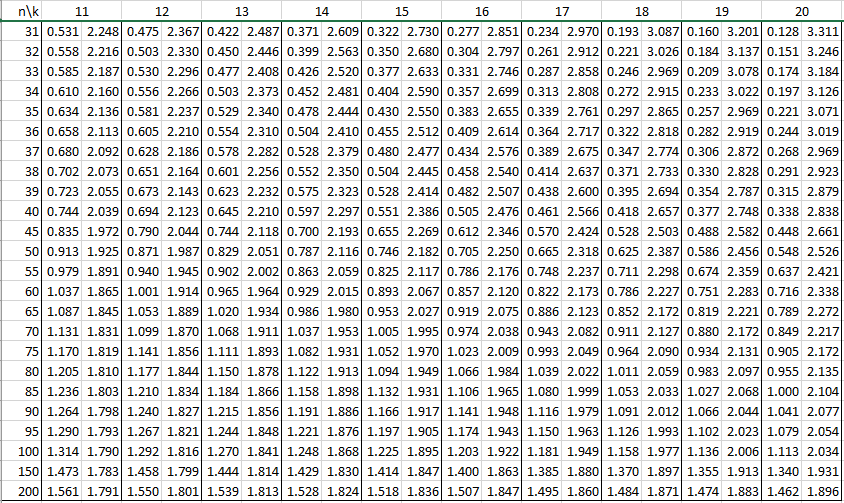
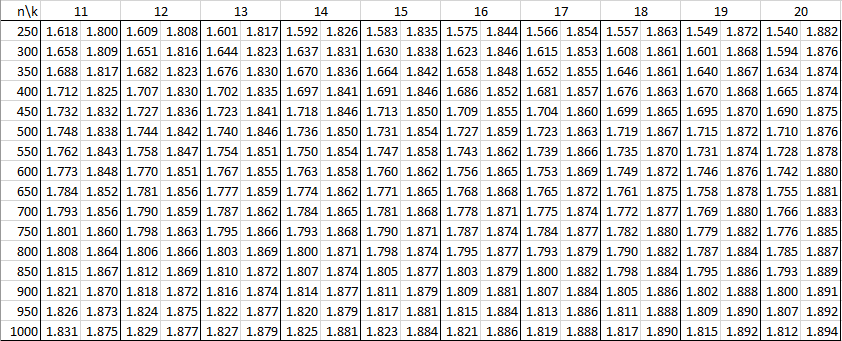
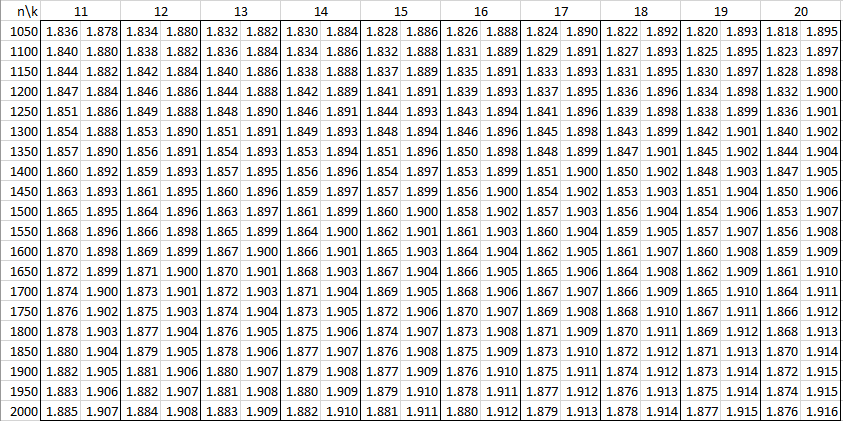
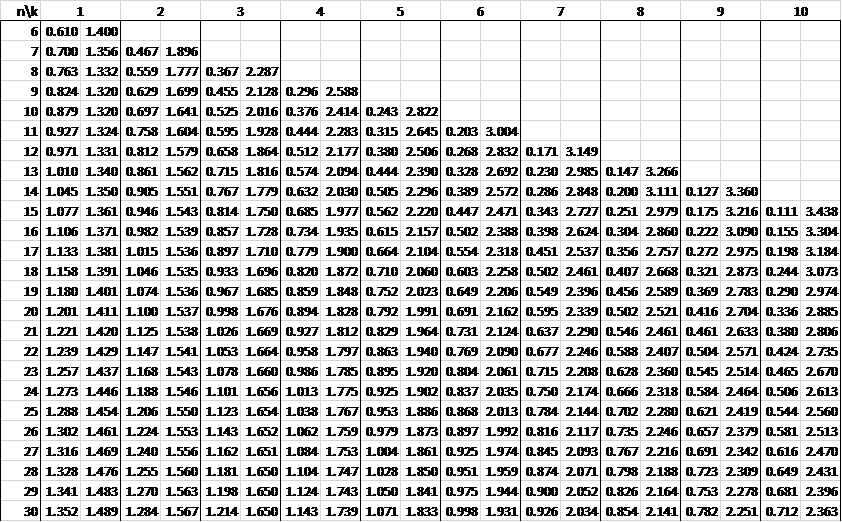
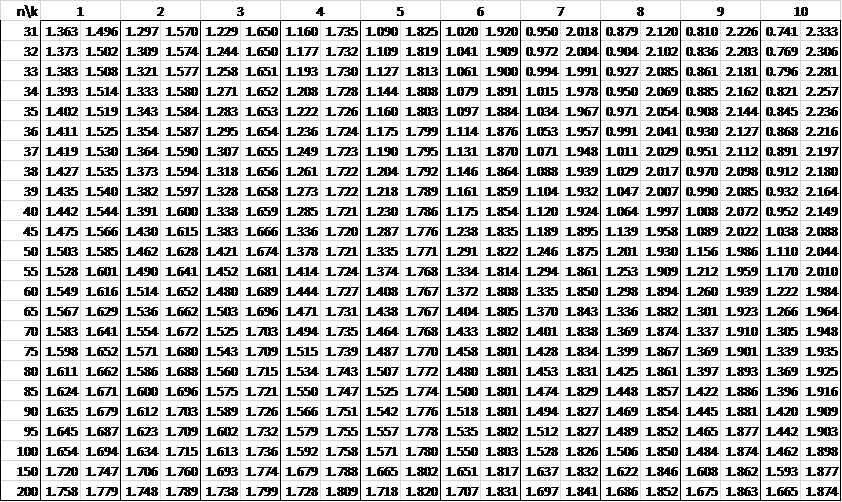
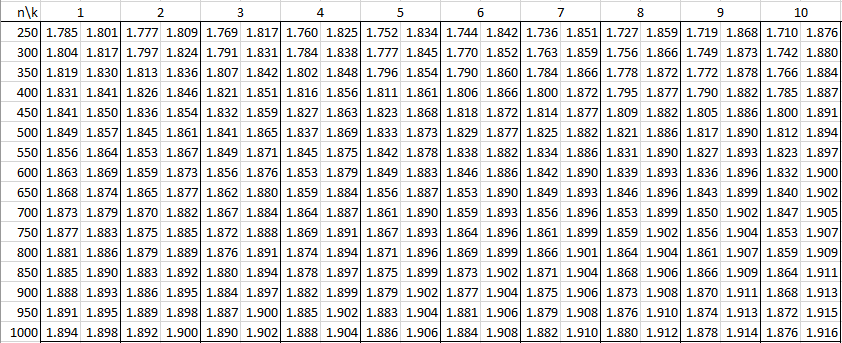
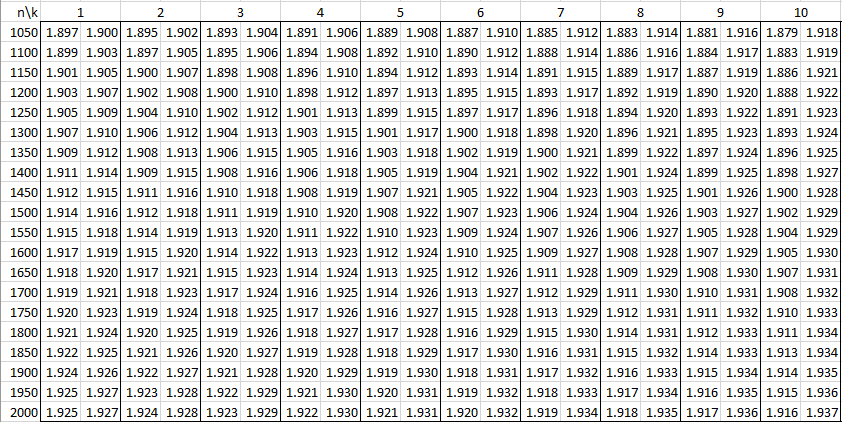
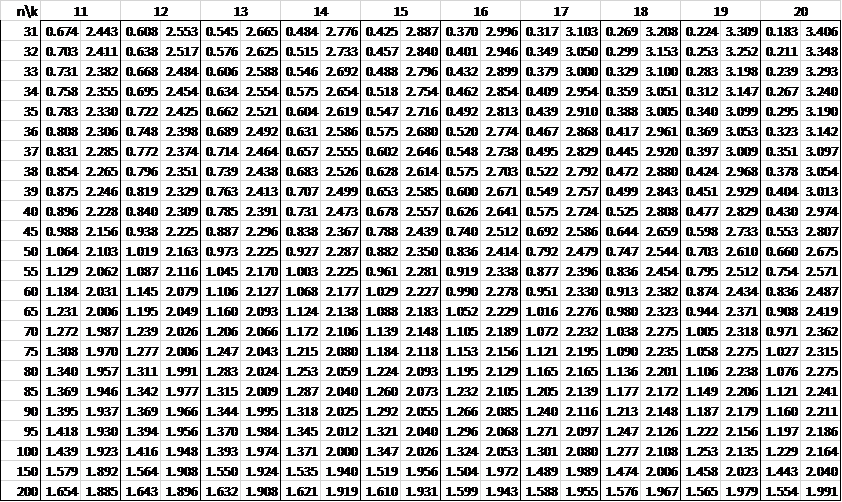
In the following tables, n is the sample size and k is the number of independent variables. See Autocorrelation for details.
Alpha = .01
Alpha = .05
References
Kanji, G. K. (2006) 100 Statistical tests. 3rd Ed. SAGE
https://uk.sagepub.com/en-gb/eur/100-statistical-tests/book229436
Evans, W. N. (2014) Durbin-Watson significance tables
No longer found online


Morning mr charles, May i know what is the Dupper and Dlower critical value for:
n=206, k=12, alpha=5%
because my computer had a problem when installing real statistics,
thank you so much for your help
The table has the values at n = 200 and n = 250. You need to interpolate between these two values. This is what the DUpper and DLower functions do. See
Interpolation
Charles
Hello,
I used the dLowercrit and dUppercrit but I’d like to know the calculations behind the formula. How are the critical value calculated? I don’t find anything in the internet regarding this. Could you send me the formula or where I can look for that?
Thanks
Alex
Hello Alex,
It is based on a table of critical values.
Charles
May i know what is the upper and lower critical value for:
a) n=50, k=8, alpha=2.5%
b) n=60, k=6, alpha= 2.5%
c) n=100, k=20, alpha= 2.5%
You need to interpolate between the table values for alpha = .01 and alpha = .05.
Alternatively, you can use the Real Statistics functions DLowerCRIT and DUpperCRIT to calculate the values for you. These functions are included in the Real Statistics Resource Pack, which you can download for free.
Charles
May I know how to interpolate between alpha= .01 and alpha= .05?
See Interpolation
But in this case it is better to use the DLowerCRIT and DUpperCRIT functions.
Charles
How to use Real Statistics functions DLowerCRIT and DUpperCRIT to calculate the values? I had already installed the Real Statistics Resource Pack.
See https://real-statistics.com/multiple-regression/autocorrelation/durbin-watson-test/
Charles
You’re way too good to these guys Charles.
Keep up the good work!
Hello, Charles!
Can you help with dL and dU, n = 233, alpha 0.05?
Thank you charles. Love your website. It helps me a lot
Hello Ben,
I will try to expand the table to include higher values for n.
In the meantime you can use the Real Statistics DLowerCRIT and DUpperCRIT functions. They are available when you download the Real Statistics software (it is free).
Glad that you are getting value from the website.
Charles
hi charles, can you help me with dl and du, N=236, alpha=0,05?
thank you, charles
Hello Catharina,
I will try to expand the table to include higher values for N.
In the meantime you can use the Real Statistics DLowerCRIT and DUpperCRIT functions to obtain these values. They are available when you download the Real Statistics software (it is free).
Charles
I have now expanded the table. You can interpolate between n = 200 and n = 250.
Charles
I have now expanded the table. You can interpolate between n = 200 and n = 250.
Charles
hi charles may i know if N=238 K=3 ALFA 0,05
You can get this information by using the Real Statistics DLowerCRIT and DUpperCRIT functions. You can download the Real Statistics software for free at
https://real-statistics.com/free-download/real-statistics-resource-pack/
Charles
Hi Charles,
Thank you very much for your introduction to the Durbin-Watson Table; this is very useful.
Can you kindly please let me know dl and du for 250 samples, 3 independent variables, and alpha 0.5?
If it is possible, can you please also show me the formula for dl/du calculation?
Thanks a lot.
Hi Albert,
I assume you mean alpha = .05. The values are 1.76851 and 1.81706.
These values are based on a table of critical values, probably compiled via simulation. It is likely that there is no simple formula.
Charles
Hello,
If my sample number is 364, the same as the number k = 3, what is the value of dL with the same dU? for the alpha 5%
1.8114 and 1.8446
Charles
Hi Charles,
Would you help me to get dl and du for 134 samples, 12 independent variables, and alpha 0.5?
k would be 12 or 11?
Thank you, I love your website!
Hi Laura,
Thank you for your kind words about the website.
k = 12
To get the dl and du values just interpolate between the values in the table for 100 and 150 (125 would be about half-way between these values, and so favor 150 slightly more). See Interpolation
Alternatively, you can use the Real Statistics DLowerCRIT and DUpperCRIT functions.
Charles
Hi, how about with n=219, alpha= 0.05 with 2 independent variables?
Thanks, Charles. Really appreciate what you share.
1.760282 and 1.797112
“Howdy” from Texas Charles!
Can you help with dL and dU, n = 188, alpha 0.05?
Much obliged, luey
Charles, I have 3 IV’s, sorry.
Hi Luis,
Just interpolate between the 150 and 200 values in the table. Alternatively, use the Real Statistics DLowerCRIT and DUpperCRIT functions to do this interpolation for you.
Charles
Can you help me to search for n=324, alpha= 0.05 with 3 independent variables.
My DW is 1.929
Hello Nga,
The lower critical value is 1.799 and the upper critical value is 1.836.
Charles
my data size 115 alpha =0.05 can you help me to find du and dl i can’t find it because i don’t have real data i just know number of data and d.w. = 1.8571
You need to interpolate between the values for n = 100 and n = 150.
Charles
Can i use linear interpolate between the values for n = 100 and n = 150. ? or just use ratio ?
You can use linear interpolation. I believe that I am using log interpolation instead in the Real Statistics software, although the results are probably not much different. Both types of interpolation are described at
Interpolation
Charles
Thank you for your answer.
Halo data saya memiliki 279 pengamatan dan 6 variabel independen. Untuk nilai dU dan dL nya berapa ya? Saya ingin tahu cara penghitungan menggunakan Excel. Terima kasih.
If you install the Real Statistics add-in then you can use the DLowerCRIT and DUpperCRIT functions to calculate these values.
For n = 279 and k = 6, the values are 1.759977 and 1.847782.
Charles
Hi Charles,
Thank you for your answer. And how do I install Real Statistics add-in?
Go to Real Statistics Resource Pack
Charles
Hi Charles,
Hasil estimasi saya menggunakan Durbin-Watson masih terkena autokorelasi. dL dan dU terlalu besar dibandingkan dengan DW. Bagaimana untuk penyembuhan terbebas dari autokorelasi? Terima kasih.
See https://real-statistics.com/multiple-regression/autocorrelation/
for how to address autocorrelation.
Charles
Hi Charles, I want to ask about 4-du. Where did the four come from? Why not 3-du or 2-du? Thank you
Hello Elok,
I don’t see what you are referring to. Where do you see 4-du?
Charles
I mean the 4-du formula from the Durbin Watson testing criteria, where does the 4 value come from? why not 3-du?
Hello Elok,
I believe that you are referring to the following webpage:
https://real-statistics.com/multiple-regression/autocorrelation/durbin-watson-test/
I believe that 4-du refers to 4 – d, i.e. 4 minus the Durbin Watson test statistic. The 4 refers to the fact that d can vary between 0 and 4 (as described on that webpage).
Charles
Halo,
data saya memiliki 204pengamatan dan 5 variabel, bisa tolong beri tahu saya nilai dl
dan du. Saya mencari perangkat lunak tetapi saya tidak bisa menemukannya.
The table values for a sample of size 200 for 5 variables at alpha .05 are 1.623 and 1.725. The value at n = 204 won’t be very different.
If you download the Real Statistics software you can use DUpperCRIT and DLowerCRIT to get the values you are looking for.
Charles
Hi, my data have 15 observations and 7 variables, could you please tell me the values of dl e du. I looked for the software but i couldnt find it.
This is in the table (n = 15 and k = 7 or 8).
Charles
Hi, my data have 228 observations and 2 variables, could you please tell me the values of dl e du. I looked for the software but i couldnt find it.
Hello Davi,
If alpha = .05 and k = 2 then you can find the values that you are looking for using the formulas =DLowerCRIT(228,2) and =DUpperCRIT(228,2). These take the values 1.765387 and 1.800752.
Charles
hi the nummber of observation of my data are 146 and i have 9 independent variables so pls tell the du and dl of my data by durbin watson test
Hello,
The values are 1.601 and 1.862 for alpha = .05. You can use the Real Statistics DLowerCRIT and DUpperCRIT functions to get this.
Charles
if the sample number is 231, the same as the number k = 2, what is the value of dL with the same dU? for the alpha 5%
Hello,
The values are 1.749 and 1.789. You can use the Real Statistics DLowerCRIT and DUpperCRIT functions to get this.
Charles
Hii, can you help me if the sample number is 218, the same as the number k = 2, what is the value of dL with the same dU? for the alpha 5%
Reply, thnkyou
You can use the Real Statistics functions DLowerCRIT and DUpperCRIT to get these values.
Charles
hey hello..
my sample size is 300 with one independent variable , but in durbin watson table there is 200 obs then according to my sample size what is my dL and Du in it?
kindly reply
The Real Statistics software can calculate values up to 2,000 observations using the DUpperCRIT and DLowerCRIT functions. For 300 observations, one independent variable and alpha =.05, the lower and upper critical values are 1.80398 and 1.81375.
Charles
Hi,
I have a sample size of 3019 do I take n=200? or is there a way that I can obtain the value for n=3019, please?
Thank you in advance
Maria,
Unfortunately, the largest tables that I have seen only go up to a sample size of 2,000. This is higher than 200 shown in this table, but still less than n = 3019. The Real Statistics DLowerCRIT and DUpperCRIT handle values up to n = 2,000. E.g. for n = 2000 with 3 independent variables and alpha = .05, dL = 1.92347 and dU = 1.92947.
For higher values you need to use a normal approximation. For n > 200, when the null hypothesis that there is no serial correlation is true the test statistic z = (2-d)*sqrt(df)/2 has a standard normal distribution, where df = n-k-1 (n = sample size and k = # of independent variables) and d = Durbin-Watson statistic. Thus, if |z| > z-crit at alpha/2, then you reject the null hypothesis (two-sided test).
I will eventually add this to the website, but for now if you need more information, you can look at the following technical paper:
Lee, M-Y. (2016) On the Durbin Watson statistic based on a Z-test in large samples, Int. J. Computational Economics and Econometrics, Vol. 6, No. 1, pp.114-121.
Charles
Good Morning,
I have three predictors, a sample size of 196 and the sig level of 0.05.
After running analysis on SPSS, the Durbin-Watson stat is 2.00. I would like to know the dL and dU critical values. I would also like to know if autocorrelation has been met.
Please could you assist?
Please read Durbin-Watson
Charles
I have read multiple times and have grasped the concept. But hitting a brick wall when trying with my question.
Good Morning,
Please guide me, I have a sample of 196. The Durbin Watson statistic is 2.00. There are three predictors. Is autocorrelation present with reference to dL and dU?
Ishtiaq,
For values larger than those shown in the table, you can use the Real Statistics DLowerCRIT and DUpperCRIT functions, as described at
Durbin-Watson Test
In any case, for 3 predictors, sample size of 196 and alpha = .05, dL = 1.7352 and dU = 1.79731.
Charles
hi , please guide me. i have 200 + sample. have done questionnai survey on 5 point likert scale. Dw is 1.4 .Does this represent insignificance and what to do to sort this matter as the data is collected one point in time. alpha=5%
regards
I need alpha=10%
Dhea,
Sorry, but I have never seen a table for alpha = 10%.
Charles
Hello charles, I have 31 obversations, 3 parameters p=5% and DW =1.3 How could i know that my model is suffering serial correlation. Noted is time series
thank you.
Kemo,
See the following webpage for information about how to test for autocorrelation using the Durbin-Watson test.
Autocorrelation
Charles
Hi Charles, thanks for the information!
I was wondering, where can I get a DW table with a = 10%?
Ica,
Sorry, but I have not seen a table with alpha = 10%.
Charles
Hi Charles,
How can I find DL and DU for n=120 with 24 independent variable
alpa 5%
Eronika,
I have not seen any tables that have more than 20 independent variables.
Perhaps the following is a property of the Durbin-Watsin statistic can be used instead: For large n, the following is true d ~ N(2,2/√n). In this case, the normal approximation of the critical value d-crit is NORMINV(α,2,2/SQRT(n)). Values of d < d-crit indicate a significant autocorrelation. Charles Charles
my DW is equal to 2,172232
What is your question?
Charles
Hi Mr. Charles,
I want to ask you something. If n=100 , k=4 and DW statistics is 2.310, is there an autocorrelation? how to determine it? thanks
Deva,
The critical values for n = 100, k = 4 and alpha = .05 are shown in the table.
See the following webpage for how to interpret the results:
Autocorrelation
Charles
Hi Mr. Charles,
How if I want to know the value for n = 440?
Maya,
Please use the DLowerCRIT and DUpperCRIT functions as described on the following webpage:
https://real-statistics.com/multiple-regression/autocorrelation/
Charles
hi charles
can you tell me n=304
Eric,
This depends on the number of independent variables and the alpha value. See the following for more information
https://web.stanford.edu/~clint/bench/dwcrit.htm
Charles
Hy Charles,
thats very great articles.
but I want to ask you something.
My teacher give me some homework, and there’s n >200. how if i want to know the value from n = 240?
thanks before.
Linda,
The value is probably fairly similar to that given for n = 200, but you can also look at the following webpages:
https://stats.stackexchange.com/questions/160830/durbin-watson-critical-values-for-large-sample-sizes
http://www.inderscienceonline.com/doi/abs/10.1504/IJCEE.2016.073370
Charles
Hi Charles,
I have data of 1.176 households over 13 weeks in my dataset, which makes 25.288 lines of data. I have 22 explanatory variables in my model + an intercept. My DW statistic is 1.511.
How can I test whether autocorrelation is an issue?
Thanks,
Mark
Mark,
Yes, this is much larger than the largest tables. See the following webpages:
https://stats.stackexchange.com/questions/160830/durbin-watson-critical-values-for-large-sample-sizes
http://www.inderscienceonline.com/doi/abs/10.1504/IJCEE.2016.073370
Charles
Hello, can you help me to get dl and du for 1346 samples, 3 variables, and alpha 0.5? Thank you.
Diva,
Here are the values for 1300 and 1350. You will need to interpolate to get the value for 1346 (although obviously it will be pretty close to the value for 1350). I assume that alpha is .05 (and not .5) and that 3 variables means in addition to the constant term.
n = 1300: dl = 1.90420 and du = 1.91345
n = 1350: dl = 1.90607 and du = 1.91498
You can also use the Real Statistics functions DLowerCrit and DUpperCrit.
Charles
Charles,
I have a time sequence of 48 numbers (quarterly crime stats in fact). DW test statistic calculates as 1.632. The alpha=5% lower and upper bounds for k=1 n=48 (interpolated) are 1.492 & 1.577. As d is > than du there is failure to reject the null of no auto-correlation. When checking against the alpha=1% bounds the interpolated lower and upper bounds are 1.310 & 1.392. d is now even farther from the upper critical value. However as the 1% test is a more rigorous test, I would have intuitively thought that the 1% upper bound would move towards the value of 2 (no auto-correlation) rather than away from it. Why is the 1% test less demanding than the 5% one for a DW test of a hypothesis?
Joe
Joe,
When alpha = 1% it should be easier to retain the null hypothesis than when alpha = 5%. This is indeed the case.
When alpha = 1% it should be harder to reject the null hypothesis than when alpha = 5%. This is indeed the case.
Charles
what is the dl and du for 258 observations with 40 independent variables at 5%, noting that the 32 of these 40 idependent variable are dummy variables used for the fixed effect model.
Sawsan,
I have not seen any tables of critical values with more than 20 independent variables. I will look into creating an approximation for such critical values.
Charles
can you help me to explain how to interpolate for n=205?
i have read your link about it, but i still don’t understand
Merin,
You won’t be able to interpolate for values of n larger than 200 since the table provided on the website only goes up to n = 200.
The following are the table values for n = 210 and alpha = .05. You can now interpolate between n = 200 and n = 210. In fact, the linear interpolations are simply the average of the values for n = 200 and n = 210 for any given value of k
n k dL dU
210 1 1.76445 1.78358
210 2 1.75483 1.79326
210 3 1.74513 1.80305
210 4 1.73537 1.81295
210 5 1.72554 1.82294
210 6 1.71563 1.83305
210 7 1.70566 1.84325
210 8 1.69561 1.85355
210 9 1.6855 1.86394
210 10 1.67532 1.87445
210 11 1.66508 1.88505
210 12 1.65478 1.89574
210 13 1.64441 1.90653
210 14 1.63398 1.91742
210 15 1.62348 1.92839
210 16 1.61293 1.93947
210 17 1.60232 1.95063
210 18 1.59165 1.96188
210 19 1.58094 1.97323
210 20 1.57015 1.98467
Charles
ok thank you so much .. that helpfull
How can I find DL and DU for n=48 with 4 independent variable
Zhyan,
This depends on the alpha value, but if alpha = .05, then the table has values for n=45 and n=50 and you will need to interpolate between these values to get the answer you are looking for. See the following webpage for details abouit interpolation:
Interpolation
Charles
Hi Charles,
How if I want to know the value for n = 665?
Fiona,
See the following webpage>
http://web.stanford.edu/~clint/bench/dw05d.htm
You will need to interpolate between the values in the table.
Charles
Hy charles, can I know how the table of durbin watson for n=204
reply my coment please 🙂
Ade,
Please see the following website, which contains values for 200 and 210. You will need to interpolate to get the value at 204.
http://web.stanford.edu/~clint/bench/dw05c.htm
Charles
please i have TTF- TIME TO FAILURES values as follows; 28,52,42,8,14,13,47,38,25,12,50,42. How do i know my n and k so to check on DW table for du and dl.
Thanks
Joel,
See the following webpage
https://real-statistics.com/multiple-regression/autocorrelation/
Charles
Please am still waiting for the answer to my question.
thanks
If a (one period) auto-correlation adjustment is made, does the adjustment count as an additional k (independent) variable in evaluating DW limits. Thanks
Brad,
What sort of (one period) auto-correlation adjustment are your referring to? Are you referring to differencing?
Charles
If I want to know for n=41, how can I know value
Aditya,
You need to interpolate the values in the table between the entries for 40 and the entries for 45. This is explained on the webpage
Interpolation
Alternatively, you can use the Real Statistics functions DLowerCrit and DUpperCrit
Charles
Thank you, Charles!
Great job.
I appreciate you spending time to have this important table available.
Warmest regards,
Francisco
Hi Charles,
thank you for all the info on this website!
I was wondering where you got those tables from? I noticed that in Durbin & Watson’s paper from 1951 (Testing for serial correlation), they only go up to an N = 100 (and I am particularly interested in higher N’s). Is there another paper that I have been missing?
Thank you!
Olga
Hi Olga,
One source is
https://www3.nd.edu/~wevans1/econ30331/Durbin_Watson_tables.pdf
Charles
Hi Charles,
thanks for the quick reply! When I click on the link, it required authorization. Do you know if there’s another source I could click on? Thanks again!
Olga
Olga, no I don’t.
Charles
Thanks for this!
Hi Charles,
Thank you for your excellent website.
Can I confirm that the k in durbin watson table excludes intercept.
Thanks
Hi Cheng,
The tables are for the case where there is an intercept, but k does not include the intercept. Thus if k = 2, there are 2 independent variables plus an intercept.
Charles
Dear Dr. Zaiontz. I was wondering, how to interpret bounds for Durbin-Watson test (dU, dL) if dU is greater than 2.0. I know that it is an extreme case, but just want to know…
For example, for alpha=0.01 if n=13 and k=8 than dU=3.182, dL=0.090. Then 4-dU=0.818, 4-dL=3.91… Does it mean that between 0.090 and 3.190 test is inconlusive? It is quite strange situation, I know that there is plenty of tests better than Durbin-Watson one, but it is nice to know such details.
Love your website (thank you!) and your nice Slavic surname.
Greetings from Central Europe.
Good to hear someone from Central Europe and thanks for your kind words about the website.
The bounds for the Durbin-Watson test are indeed strange. If the test produces a value between dL and dU, i.e. between .818 and 3.10 in this case, then yes the test is inconclusive.
Charles