We can use the intraclass correlation coefficient (ICC) for test/retest reliability (see Split-Half Reliability). This is especially useful in the pilot phase of questionnaire design in measuring consistency.
Example 1: How many students are required to determine the test/retest reliability of the total score of a psychometric test instrument that measures anxiety levels in patients with dementia, where we seek to achieve an ICC(1,1) of .60 with power of at least 80%.
Since the number of raters (i.e. tests) is 2, we use the formula =ICC_SIZE(0,.6,2,.8) to obtain a minimum sample size of 15 (see ICC Continued). If you want to achieve 90% power, you will need a sample of size 20, but if you want to detect an ICC of .75 with 90% power, a sample as small as 11 subjects is sufficient.
Example 2: Use an ICC(1,1) model to determine the test/retest reliability of the dementia psychometric test instrument based on the scores of the 15 patients on the left side of Figure 1 at Time 1 and Time 2, two weeks later.
Using the same approach as for Example 1 of ICC for Comparisons against a Gold Standard, we obtain an ICC of .746, as shown in cell M9 of Figure 1, with a 95% confidence interval of (.387, .907).
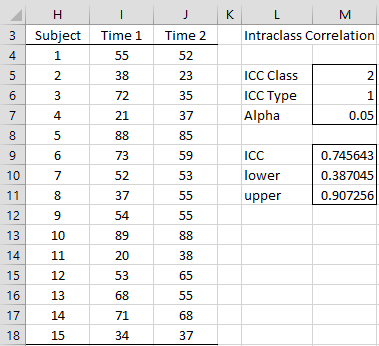
Figure 1 – Test/retest reliability
Example 3: Use an ICC(1,1) model to determine the test/retest reliability of a 15-question questionnaire based on a Likert scale of 1 to 5, where the scores for a subject are given in column B of Figure 2 and the scores for the same subject two weeks later are given in column C.
The ICC of .747 is shown on the right side of Figure 2.
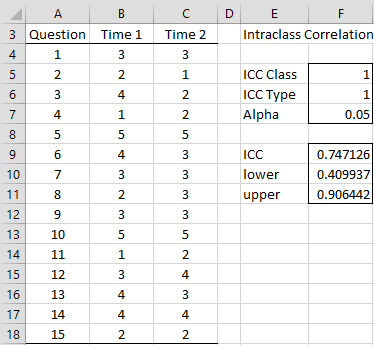
Figure 2 – Test/retest reliability
Examples Workbook
Click here to download the Excel workbook with the examples described on this webpage.
Links
References
Loo, T. K., Li, M. Y. (2016) A guideline of selecting and reporting intraclass correlation coefficients for reliability research. Journal of Chiropractic Medicine 15, 155–163
https://www.ncbi.nlm.nih.gov/pmc/articles/PMC4913118/
Qin, S., Nelson, L., McLeod, L., Eremenco, S., Coons, S. J. (2018) Assessing test–retest reliability of patient-reported outcome measures using intraclass correlation coefficients: recommendations for selecting and documenting the analytical formula
https://link.springer.com/article/10.1007/s11136-018-2076-0
Assana, S. (2022) A beginner’s guide to the intraclass correlation coefficient (ICC)
https://medium.com/@SalahAssana/a-beginners-guide-to-the-intraclass-correlation-coefficient-icc-288f7fe7bcfc
Weir, J. (2005) Quantifying test-retest reliability using the intraclass correlation coefficient and the SEM
https://www.researchgate.net/publication/8028009_Quantifying_Test-Retest_Reliability_Using_The_Intraclass_Correlation_Coefficient_and_the_SEM
Hi Charles. Could I use the same approach when there are 2 raters but the scores for a given metric are simply “0” or “1”? For example, if a rater is evaluating the presence (ie “1”) or absence (ie “0”) of something. Any advice would be great appreciated.
Hello Mark,
Initially, I thought that ICC would not be suitable for dichotomous data, but as I look into this further it does seem that ICC is indeed used with dichotomous data. In any case, the following may be helpful to you:
https://stats.stackexchange.com/questions/213743/test-retest-of-highly-skewed-dichotomous-variables
https://www.hsph.harvard.edu/wp-content/uploads/sites/59/2016/10/harvard-lecture-series-session-2_Reliability.pdf
Charles
Actually, the issue arrises when there is negative correlation due to testakers with lower scores on the test generally getting high scores on the retest, while testtakers with higher scores on the test not improving their performance as much on the retest and/or getting lower scores on the retest, such that the mean of the retest may be higher but the correlation retest and test is negative.
Hi Charles! I am back with another question. Using ICC(1,1) for a test-retest scenario, I sometimes get a neagative value for certain segmetations of my data set. This seems follow the direction of the correlation between my test and retest scores. That is, if the mean retest score is lower than the mean test score, and there is a negative correlation, then there tends to be a negatie ICC value. Is this to be expected? How should this be interpreted? I am finding mixed info ont the Web. Thanks a lot!
Hi Mike,
The values of the ICC and correlation do seem to be similar. I did come up with a made-up example where the signs are different:
(4,0), (5,2), (5,2), (2,5), (7,5).
Charles
Thanks a lot for this reply! Later I saw that the directions are not always the same. It seems that if low test scores tend to result higher retest scores while high test scores result in lower retest scores, you get a situation with very low, possibly negative ICC, and a negative correlation. But I have seen that sometimes the correlation is positive while the ICC is negative. With my data, I have not yet seen a case where ICC is positive and r is negative. That seems logical to me though. So I guess this is just one situation where you can get a negative ICC.