Basic Concepts
One way to determine the reliability of a test is to repeat the test. This is not always possible. Another approach, applicable to questionnaires, is to divide the test into even and odd questions and compare the results.
Example
Example 1: 12 students take a test with 50 questions. For each student, the total score is recorded along with the sum of the scores for the even questions and the sum of the scores for the odd questions, as shown in Figure 1. Determine whether the test is reliable by using the split-half methodology.

Figure 1 – Split-half methodology for Example 1
The statistical test consists of looking at the correlation coefficient (cell G3 of Figure 1). If it is high, then the questionnaire is considered to be reliable.
r = CORREL(C4:C15,D4:D15) = 0.667277
See Basic Concepts of Correlation for more information about the correlation coefficient r.
Spearman-Brown correction
One problem with the split-half reliability coefficient is that since only half the number of items is used, the reliability coefficient is reduced. To get a better estimate of the reliability of the full test, we apply the Spearman-Brown correction, namely:
![]()
This result shows that the test is quite reliable.
This version of the Spearman-Brown correction works properly when the two halves have equal lengths. If not, then we can use the following formula (provided r ≠ ±1):
where c = 2p(1–p), where p = the proportion of the test due to the first half. Note that if the two halves are equal, then c = 2(.5)(.5) = .5, and so
![]()
Note that if a test has an odd number of items, 2n + 1, then p = n/(2n+1), and so
![]()
For example, if we obtain a correlation coefficient of .6 on a 3-4 split of a 7-question test, then c = 2⋅3⋅4/72 = .489796 and so

which is slightly higher than the result that would be obtained if we assumed an even number of questions, i.e.
![]()
Note that SB_CORRECTION(.6,5,2) = .756 using the Real Statistics function described next.
Worksheet Functions
Real Statistics Functions: The Real Statistics Resource Pack contains the following functions:
SB_CORRECTION(r, n, m) = Spearman-Brown correction when the split-half correlation based on an m vs. n-m split is r. If n is omitted, then it is assumed that there is a 50-50 split. If n is present, but m is omitted, then it is assumed that m = Int(n/2).
SB_SPLIT(R1, s) = split-half coefficient (after Spearman-Brown correction) for data in R1 based on the split described by the string s. String s consists of 0’s and 1’s where each character in the string corresponds to one column in R1 (thus, the length of s must be equal to the number of columns in R1)
SPLIT_HALF(R1, R2) = split-half coefficient (after Spearman-Brown correction) for data in ranges R1 and R2; assumes a 50-50 split.
SPLITHALF(R1, type) = split-half measure for the scores in the first half of the items in R1 vs. the second half of the items if type = 0 and the odd items in R1 vs. the even items if type = 1.
The SPLIT_HALF function ignores any empty cells and cells with non-numeric values. This is not so for the SPLITHALF function.
For Example 1, SPLIT_HALF(C4:C15, D4:D15) = .800439.
Different splits
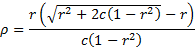
Example 2: Calculate the split-half coefficient of the ten-question questionnaire using a Likert scale (1 to 7) given to 15 people whose results are shown in Figure 2.

Figure 2 – Data for Example 2
We first split the questions into two halves: Q1-Q5 and Q6-Q10, as shown in Figure 3.
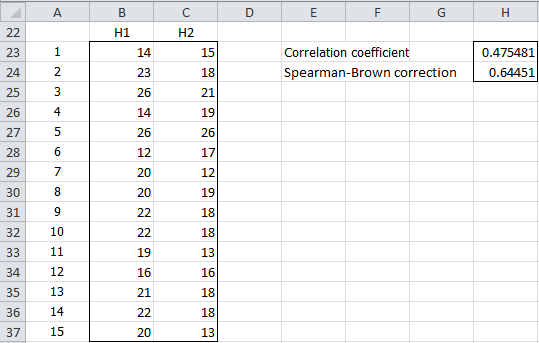
Figure 3 – Split-half coefficient (Q1-Q5 v. Q6-Q10)
E.g. the formula in cell B23 is =SUM(B4:F4) and the formula in cell C23 is =SUM(G4:K4). The coefficient 0.64451 (cell H24) can be calculated as in Example 1. Alternatively, the coefficient can be calculated by the worksheet formula =SPLIT_HALF(B23:B37,C23:C37) or =SPLITHALF(B4:K18,0).
We can also split the questionnaire into odd and even questions, as shown in Figure 4.
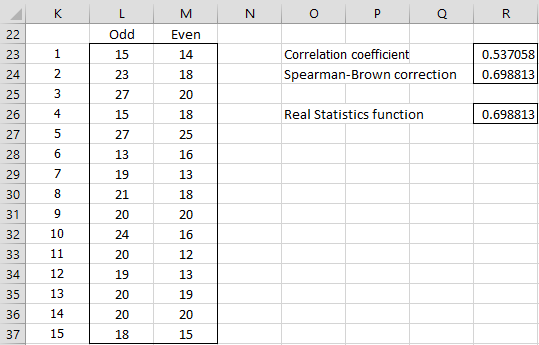
Figure 4 – Split-half coefficient (odd v. even)
E.g. the formula in cell L23 is =B4+D4+F4+H4+J4, and the formula in cell M23 is =C4+E4+G4+I4+K4. The coefficient 0.698813 (cell R24) can be calculated as in Example 1. Alternatively, the coefficient can be calculated by the Real Statistics formula =SPLIT_HALF(L23:L37,M23:M37) or =SPLITHALF(B4:K18,1).
Examples Workbook
Click here to download the Excel workbook with the examples described on this webpage.
Links
References
Wikipedia (2016) Spearman-Brown prediction formula
https://en.wikipedia.org/wiki/Spearman%E2%80%93Brown_prediction_formula#:~:text=The%20Spearman%E2%80%93Brown%20prediction%20formula,after%20changing%20the%20test%20length.
Horst, P. (1951) Estimating total test reliability from parts of unequal length
https://onlinelibrary.wiley.com/doi/pdf/10.1002/j.2333-8504.1950.tb00474.x
Eaton, P. (2016) Reliability. Johns Hopkins Bloomberg School of Public Heath
No longer available on the Internet
Gebotys, R. (2003) Handout on reliability
https://studylib.net/doc/8088080/reliability-analysis
Nydick, S.W. (2012) The relationship between Spearman-Brown and Cronbach’s alpha
https://swnydick.github.io/assets/reports/Spearman_Brown_and_Coefficient_Alpha.pdf
Dear Charles,
1. I had 20 items in a test and did split half test and then discriminating index, and then discarded 1 item of that test. Should I have to again do split half reliability test with 19 items or not.
2. What will be value of c for 19 items in a test and 59 items in a test.
Awaiting your reply
Regards
Nusrat
See my previous response.
Charles
Dear Charles,
1. Will please explain how you got 2-3 split for 7 question test and c=2(.4)(.6).
2.Also if you could give me a clarity on doing split half reliability analysis on 19 items of a test. And on 59 items of a test.
3. Also if we take a test say for eg. On 20 items and do a discriminating index and later drop one item. What would be the method (formula) to do split half in that case.
4. In case of 10 items can we split first half (1-5) and second half(6-10) and do split half reliability method or we have to take odd even items of the test.
Awaiting your reply
Thanking you in anticipation
Regards Nusrat
Dear Nusrat,
1. Thanks for your question. As a result, I see that the calculation shown is incorrect. I have now corrected the calculation.
2. The approach described on the webpage should also hold for 19 or 59 items.
3. There probably is an easy way to calculate the revised split-half metric based on the previous split-half metric, but it is simple enough to simply calculate the split-half metric based on the remaining 19 items. This will change the odd/even split.
4. You can do either. There is no right way or wrong way to split the items, although it is usually best to split them as evenly as possible. You should also specify how you made the split when you report your results.
Charles
Thanks for clarifying my doudts. I could calculate split half for 19 and 59 items using formula😊. May God bless you 🙏
Hi Charles,
My question is how can I get correlation coefficient (r) in a formula 2r/1+r so that it will be easy for I to find out reliability on full test?
As explained on the webpage you can use a formula such as r = CORREL(C4:C15,D4:D15), as shown below Figure 1.
Charles
Hey guys please I didn’t understand how to get correlation efficient is by subtract, divide or sum
Jacobo,
Sorry, but I don’t understand what coefficient you are referring to.
Charles
This seems pretty clear, thanks. If I understand correctly, I can do a Spearman-Brown correction in Excel on a value on which I’ve already performed a =CORREL() as follows:
=(2*W82)/(1+ABS(W82))
Will that work?
P.S. You seem to have a couple of typos above in your =SPLIT-HALF() parameters: seems you have a comma specific in some of the ranges instead of a colon.
Peter,
Yes, that should work.
Thanks for catching the typos. I have now corrected them on the webpage.
Charles
Thanks for the highlight sir, I did my and I got 0.60 does this shows acceptable point of reliability and to which scholar can this be attributed to?
Isah,
There isn’t universal agreement as to what is an acceptable reliability cutoff. Usually, .70 or higher is viewed as acceptable, although .60 might be viewed by some as acceptable.
Charles
Dear Charles
I don’t understad why using SPLIT_HALF vs. SPLITHALF functions on the same dataset yield different results (I tried also with the data of the workbook example).
Hello Benedetto,
There was an error in the SPLITHALF function, which I fixed in the bug-fix release (Rel 7.0.5) that I just issued. Please let me know whether this corrects the problem.
Thanks for informing me of this problem. I appreciate your help in improving the reliability of the Real Statistics product.
Charles
Thank you Charles, now it works fine. It seems that the new release fixes also another prblem I had with the Guttman formulas (now they works too). Thank you for your support and for your excellent software. I am using it to analyse data on consumers behavior with my students at our Master Course in Business Management at the University of Florence.
Hello Benedetto,
Glad I could help and sorry that I didn’t catch the bug in Rel 7.0 sooner.
Charles
Qual’e la situazione con il virus a Firenze? Qui, in Oltre Po’ la situazione e’ molto dura.
A Firenze il principale ospedale per ora non ha mai raggiunto la capienza massima di terapia intensiva (che è stata potenziata), anche se c’è stato un picco importante. La Toscana ha avuto tempo per prepararsi. Spero si cominci a vedere un miglioramento anche da voi.
Grazie
Charles
Dear Charles, can i use Spearman rank order correlation coefficient to calculate the correlation coefficient of slit-half
Emmanuel,
I don’t see why you would want to use Spearman’s rank order for this purpose, but see my response to your other comment.
Charles
Thanks for answering. Do I use split-half with the results I already have or do I need to administer them to another group? What comparison do you recommend for validity?
You can use splt-half with the group you have.
Charles
If I have a test of 84 items of true or false and will be conducted on 44 students, could I use KR 20 formula to test its reliability? Or should I use the split half method
Eman,
You can use KR20 (or equivalently Cronbach’s alpha)
Charles
what is the difference between spearman Brown correction formular and spearman rank order correlation
I don’t know of any connection between these two, although someone else may tell that there is a connection.
Charles
Hello Charles,
In my classes (2 sections, 85 students), I have administered a reading comprehension test (5 selections with 10 multiple choice questions, a total of 50 items). Then I was asked about how reliable and valid my test was. Which method do you recommend? Will this also be applicable if I do a pre-test/post-test?
Hello LT,
You can use the split-half or Cronbach’s alpha to measure reliability. Validity is more difficult to test. Best is to compare the results with a test that is already known to be valid.
Charles
Hi Charles
How will i calculate the split-half reliability of my research instrument by using SPSS?
The instrument (Questionnaire) consisted of 6 variables, The detail of items in each variable is given below;
First variable: 16 items
Second variable: 4 items
Third variable: 4 items
Fourth variable: 6 items
Fifth variable: 4 items
Sixth variable: 4 items
Total number of items in questionnaire are 38 while conducted on 30 stakeholders (i.e 20 students and 10 teachers). Plz give answer in detail, I’ll be much obliged to you.Thank you
Hello Muti,
I don’t use SPSS and so I am unable to answer your question. The Real Statistics website and software focus on statistical analysis using Excel.
Charles
Ok how i’ll calculate split-half reliability by using excel?
Hi Muti,
See https://real-statistics.com/reliability/split-half-methodology/
Charles
See https://www.youtube.com/watch?v=GK82PJCncNk for an SPSS walkthrough.
How can i find the reliability of an achievement test having 10 questions and conducted on 50 students? Please answer me.
Regards
Roha,
There are number of ways of measuring reliability in this case, including the split half measure described on this webpage. The usual method is via Cronbach’s Alpha. See
Cronbach
Charles
Can Split half test be employed on questionnaire based on likert scale and that has 8 diiferent variables that are measured by several statements. There are few variables which just have 4 statements only.
Thank you in advance!!
Ashutosh
Hello Ashutosh,
What is the relationship between the variables and the questions? How many questions relate to each of the 8 variables?
Charles
The number of statements varies, ranging from 4-8. 5 variables are personality related and 3 are behavioral biases in decision making. i.e. overconfidence, herding and disposition biases
You would need to run separate Split-half tests, one for each variable. With only 4 questions, your results will be limited.
Charles
Hi Charles,
I am Kushagra from Mumbai and am pursuing MA in Industrial Psychology.
The answer to this question is needed at the earliest.
How will I calculate Item Endorsement Index and Item Total Correlation on a scores given by a single individual on the following scales:
1. Attitude Towards Matrimonial Sites validated against Marriage Perception Scale by Anshu Shukla, Sangita Deodiya and T.B. Singh.
2. A Gratitude Scale standardized or validated against the Gratitude, Appreciation, and Resentment Test (GRAT).
3. A Rejection Sensitivity Scale standardized against the RSQ/RS – Personal Scale (Feldman & Downey, 1994).
4. A Novelty Seeking Scale standardized against the Temperament and Character Inventory (TCI).
5. An Emotional Eating Scale standardized against the Emotional Eating Scale by Arnow et al.
6. A Validation Scale standardized against MLAM Scale or the Martin Larsen Approval Motivation Scale as well as the questionnaire developed by Knud A. Larsen et al., to measure attitude towards validation on physical appearance and interpersonal relationships in 1976.
NOTE: All 6 scales are different from each other and belong to 6 different research papers that I am developing.
Thanks and Regards
Kushagra,
I am not familiar with the various sources that you are referencing (GRAT, MLAM, etc.) and so I am unable to comment on these. The Item Total Correlation is described at Item Analysis.
Charles
Hi Charles,
Please what is the interpretation for this spilt half formula: n x r
1+(n-1)r
Eky,
I don’t see this formula on the webpage. Where did you find it?
Charles
Here is the formula:
n x r
1+(n-1)r
Hi Charles,
Please what will be the reliability coefficient using the spilt half method with a 17 item question for 20 students?
Eky,
You can place 8 of the questions in one split-half and 9 of the questions in the other (e.g. using odd/even or some random split). The Spearman’s correct is slightly different when the two halves are not of the same size, but how to do this is explained on this webpage.
Charles
Hi Charles,
Thank you for your reply. Please which of the spilt half method should I use exactly because the one I used is giving me a reliability coefficient below .67 which does not make the instrument reliable. I need a .80 reliability coefficient for my instrument to be reliable, thank you.
Eky,
I suggest that you use Cronbach’s alpha instead of the split-half method since it is sort of an average of all possible split half scores.
You shouldn’t try to shop around for a measurement that gives you the result you desire. Instead you should try to fix the underlying problem. The usual reasons for a lower than desired measurement are described on the following webpage:
Cronbach’s alpha
Charles
Thank you Charles, am so grateful. I will try the Cronbach alpha method. I will get back to you on the result
What kind of reliability test I’ll use if I’m using modified tools
Saya,
What do you mean by “modified tools”?
Charles
Hi Charles
For pretest anc post test study, how we do reliability?
Can we take onle pretest marks for split half??
Jasdeep,
Sorry, but I don’t understand your question. What do you mean by reliability for pretest/post test?
Charles
Hi Charles. Can Pearson’s Product Moment Correlation formula be used to determine split-half reliability of a questionnaire.
Ukoha,
Yes, Pearson’s Product Moment Correlation is used to calculate the split-half reliability (after making the Spearman-Brown correction).
Charles
In 50 students not all respond on 30 items questions. Its that ok?
Aina,
Yes, but you will have to do something about the missing data. This shouldn’t too much of a problem if there isn’t too much missing data. Also it depends on what the scoring is. If the scoring nets out to right/wrong answer then missing data may be interpreted as wrong. If the scoring is on a Likert scale then either you can remove all students with some missing data value or use some imputed value for the missing scores (e.g. assign the middle Likert score value to the missing scores or the average score among all the students for that item or the average score on the other items for that student or some more sophisticated imputed value). This may not be a problem with a few missing items, but can be a big problem if there are too many scores.
The topic of missing data is covered in great detail throughout the website.
Charles
What if my questionnaire is a combination of likert scale and objective type, an answer is scored either 0 or 1. Can I use split-half to get the reliability of my questionnaire?
Rosie,
You can use the split-half method, but I am not sure about the meaning of the results. In particular, it is important that both types of questions are measuring the same concept.
Charles
Hi, pls I can I carry out split half method on 14 students using 14 questionnaires that contain 20 questions. Pls, I need answers urgently. Thanks
In this case, you have to first determine what your goal is. If your goal is to determine the reliability of each questionnaire, then you simply carry out 14 separate split half tests, one for each questionnaire. If instead you want to determine the reliability of all the questions in all 14 questionnaires, then you could assume that you have one “questionnaire” with 14 x 20 = 280 questions. You can now create the split halves in a variety of ways: e.g. one split half consists of all the odd questions from any of the questionnaires and the other split consists of the even questions. Another approach is to use all the questions from the odd questionnaires as one split half and the remaining questions in the other split half.
This approach assumes that all the questionnaires are testing the same concept. If the questionnaires are testing different topics, then you should 14 separate split half analyses.
There are other possibilities depending on the relationship between the different questionnaires.
Charles
How can I carry out the split half method using 20 questionnaires for 50 students please I need urgent help
I assume that by 20 questionnaires you mean 20 questions, although the result will be the same.
The approach is exactly the same as in Example 1, where one split half consists of the odd questions and the other split half consists of the even questions. Instead of using an odd-even split you can use a variety of other splits, including selecting 10 questions at random for one split half and the remaining questions for the other split half (provided you use the same split for all 50 students).
Charles
How can I carry out the split half method using 20 questionnaires for 50 students please I need urgent help
Rita,
Does each of the 50 student respond to all 20 questionnaires?
Charles
Hi Charles ; what i do when the number of items is not the same in the tow parts of the questionnaire?
You can still perform an odd/even split, but in this case the last question in the questionnaire won’t factor into the calculation of the split-half coefficient. If this is undesirable, then you can always use a different reliability measurement, such as Cronbach’s alpha, which doesn’t have this problem.
Charles