The intraclass correlation (ICC) assesses the reliability of ratings by comparing the variability of different ratings of the same subject to the total variation across all ratings and all subjects. The ratings are quantitative. If your data are qualitative (categorical), you should not use the ICC.
Topics
- Basic concepts of the ICC(2,1) model (this webpage)
- Other ICC models
- Using ICC for comparisons against a gold standard
- Using ICC for test/retest reliability
Examples
We illustrate the ICC technique applied to Likert scales via the following example.
Example 1: Four judges assess 8 types of wine for quality by assigning a score from 0 to 9, with the ratings given in Figure 1. Each judge tests each wine once. We would like to determine whether the wines can be judged reliably by different judges.

Figure 1 – Data for Example 1
We can see from the data that there is a fair amount of consistency between the ratings of the different judges, with a few noticeable differences.
We will assume that the four judges are taken from a random sample of judges and use Excel’s Anova: Two Factor without Replication data analysis tool (i.e. a repeated-measures analysis). Figure 2 shows the results of this analysis.

Figure 2 – Calculation of Intraclass Correlation
Here, the rows relate to the Between Subjects (Wines) and the columns relate to the Judges (who are the raters). The error term is Judge × Subjects. We have added row 29 that contains the calculation of the ICC (in cell I29) using the formula
=(J23-J25)/(J23+I24*J25+(I24+1)*(J24-J25)/(I23+1))
ICC based on Variability
We will now explain this formula. From Definition 1 in Two Factor ANOVA without Replication, we have the model
![]()
The intraclass correlation is then
![]()
Thus, there are three types of variability:
var(β): variability due to differences in the subjects (i.e. the wines).
var(ε): variability due to differences in the evaluations of the subjects by the judges (e.g. judge B really likes wine 3, while judge C finds it to be very bad)
var(α): variability due to differences in the rating levels/scale used by the judges (e.g. judges B and C both find wine 1 to be the worst, but while judge C assigns wine 1 a Likert rating of 0, judge B gives it a bit higher rating with a 2).
We can estimate each of these as follows:
var(β) = (MSRow – MSE)/k = (26.89 – 2.28)/4 = 6.15
var(ε) = MSE = 2.28
var(α) = (MSCol – MSE)/n = (2.45 – 2.28)/8 = 0.02
where n = number of rows (i.e. subjects = wines for Example 1) and k = number of columns (i.e. raters = judges). We, therefore, obtain a consistent (although biased) estimate of the intraclass correlation by
ICC = 6.15/(6.15 + 2.28 + 0.02) = 0.728
This can also be expressed by
![]()
![]()
The high value of ICC shows there is a fair degree of agreement between the judges.
Real Statistics Support
Real Statistics Function: The Real Statistics Resource Pack contains the following function:
ICC(R1) = intraclass correlation coefficient of R1 where R1 is formatted as in the data range B5:E12 of Figure 1.
For Example 1, ICC(B5:E12) = .728. This function is actually an array function that provides additional capabilities, as described in Intraclass Correlation Continued.
Real Statistics Data Analysis Tool: The Interrater Reliability data analysis tool supplied in the Real Statistics Resource Pack can also be used to calculate the ICC. We show how to use this tool in Intraclass Correlation Continued.
Observation: There are a number of other measures of ICC in use. We have presented the most useful of these measures above. Click here for information about these other versions of ICC.
Confidence Interval
We now show how to calculate an approximate confidence interval for the ICC. We start by defining the following
![]()
![]()
![]()
![]()
![]()
![]()
Note that for newer versions of Excel, the FINV function should be replaced by F.INV.RT.
From these, we calculate the lower and upper bounds of the confidence interval as follows:
![]()
![]()
Using these formulas, we calculate the 95% confidence interval for ICC for the data in Example 1 to be (.434, .927), as shown in Figure 3.
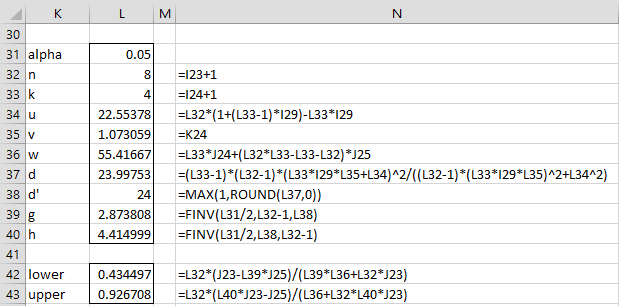
Figure 3 – 95% confidence interval for ICC
As stated above, for newer versions of Excel, the FINV function in cells L39 and L40 should be replaced by F.INV.RT.
Observations
The ratings by the judges indicate the difficulty or leniency of the judge. The raters can also be questions in a test. In this case, the rating corresponds to the difficulty or leniency of the question.
The measure of ICC is dependent on the homogeneity of the population of subjects being measured. For example, if the raters are measuring the level of violence in the general population, the value of var(β) may be high compared to var(α) and var(ε), thus making ICC high. If instead the raters are measuring levels of violence in a population of inmates from maximum-security prisons, the value of var(β) may be low compared to var(α) and var(ε), thus making ICC low.
There isn’t universal agreement as to what constitutes an acceptable ICC value. This can also depend on the field in which it is used. E.g. in the medical field, an ICC less than .40 is considered to be poor, between .40 and .50 fair/moderate, between .60 and .75 good, and ICC = .75 and above excellent. Others will change these boundaries to .50, .75, and .90, respectively.
Examples Workbook
Click here to download the Excel workbook with the examples described on this webpage.
Links
References
Shrout, P .E. and Fleiss, J. L. (1979) Intraclass correlations: Uses in assessing rater reliability. Psychol. Bull., 86: 420-428.
https://www.aliquote.org/cours/2012_biomed/biblio/Shrout1979.pdf
Loo, T. K., Li, M. Y. (2016) A guideline of selecting and reporting intraclass correlation coefficients for reliability research. Journal of Chiropractic Medicine 15, 155–163
https://www.ncbi.nlm.nih.gov/pmc/articles/PMC4913118/
Wu, S., Crespi, C. N., Wong, W. K. (2012) Comparison of methods for estimating the intraclass correlation coefficient for binary responses in cancer prevention cluster randomized trials
https://pubmed.ncbi.nlm.nih.gov/22627076/
Li, L.., Zeng, L., Lin, Z., Cavell, M, Lui, H. (2015) Tutorial on use of intraclass correlation coefficients for assessing intertest reliability and its application in functional near-infrared spectroscopy–based brain imaging. Journal of Biomedical Optics.
https://www.spiedigitallibrary.org/journals/journal-of-biomedical-optics/volume-20/issue-05/050801/Tutorial-on-use-of-intraclass-correlation-coefficients-for-assessing-intertest/10.1117/1.JBO.20.5.050801.full?SSO=1
Hello,
I was wondering if ICC would be appropriate to assess interrater reliability when looking at two coders for a systematic review that coded some continuous variables (e.g., what was the sample size from each study included in the review, average age of those samples). There are some cases where the variables are categorical and my understanding is that cohen’s kappa is appropriate for that data but I wasn’t sure for data that was numerical/continuous. Any help would be appreciated, thanks!
Jen
Hello Jen,
I believe that all the interrater measurements assume that the ratings are all of a similar type, and so you shouldn’t mix categorical with numeric ratings. You can use ICC for numeric ratings and Cohen’s kappa with categorical ratings.
Charles
Hi,
Would it be possible to obtain ICC for a single variable?
Thanks
It depends on what you mean by a single variable, but you need multiple raters and multiple subjects.
Charles
Hi Charles,
Thank you for the ICC tutorial!
Do you by any chance have the excell file with the working “judge-wine” example avaiable for download?
Best regards
Jens Borgbjerg
Hello Jens,
You can find all the examples at
Real Statistics Examples Workbooks
Charles
Thank you.
Thanks for this. I find the website an amazing resource. I need to calculate the ICC for three raters that gave to 150 samples a non-numerical category (and I have 3 of them, like blue, yellow, red). How would you go about it. It’s the first time I encounter this as usually I have two raters and can calculate a Cohen’s kappa with Graphpad.
Thanks for any help or pointer.
Hello Pietro,
Assuming there is no order to the three ratings, you can use Fleiss’ kappa (an alternative to Cohen’s kappa when you have more than two raters). Alternatively you can use Gwet’s AC2 or Krippendorff’s Alpha. Gwet’s is probably the best choice, but the others should be fine as well. All three of these are described on the Real Statistics website.
Charles
Thanks Charles, very helpful – I have never seen someone responding so quickly! Best, Pietro Ghezzi
Please I have some questions on processes of calculating intraclass correlation.
1. Is it the scores that are correlated or the mean scores?
2. What gives the correlation coefficient,the average of the scale of mean of item is delected, scale variance if item delected, corrected item- total correlation, squared multiple correl6 or the average of Chronbatch’s Alph if item selected coloums?
1. Probably scores, but it depends on what you are using the intraclass correlation for.
2. I don’t understand your question.
Charles
Hi,
I’m running general linear mixed models and generalised linear mixed models where I would like to calculate ICC for one of the random factors. Could I do that with help of the formula above (ie ICC(R1) = intraclass correlation coefficient of R1 where R1 is formatted as in the data range B5:E12 of Figure 1), or is the procedure different from analysis to analysis?
If the above works, should I then arrange the data so that each ID in the random factor have it’s own column, and one row for the dependent factor?
Thank you so much in advance!
Tina
Hi Tina,
You can do all of these things, but the question I have for you is what do you want to accomplish? Why do you want to use the ICC in the first place?
Charles
Hi, thanks for a quick reply! I’ve seen in different papers that ICC is used to assess the proportion of variance explained by for example family (ie genetic relatedness), if you study siblings and have family as a random factor, in comparison with other random factors, such as for example “container”, which some siblings are reared in.
I understand your reply as if it’s possible to use the procedure described above for this purpose?
Cheers,
Tina
Hi Tina,
Can you give me a reference to one or two of these papers so that I can understand better what they are saying?
Charles
Hello, I’m trying to use this program in excel and I have my columns that I want to measure aligned next to each other, but when I click ICC I cannot figure out what to input in each category (Rg, Rcase, Rtype, Lab, Alpha) I have read through this page and the continued page many times and I cannot figure it out. Is there a video or something?
Hello Sarah,
If you only need to calculate the ICC as described on this webpage, then you only need to supply rg, the range which contains your data, i.e. use a formula of the type ICC(R1) where R1 is a cell range containing your data. Otherwise see the following webpage:
https://real-statistics.com/reliability/intraclass-correlation/intraclass-correlation-continued/
Charles
Hello
Is there a way of using columns that are not adjacent to one another for the input arrays?
Thank you
Stuart
Stuart,
Sorry, but in the current version of the Real Statistics ICC data analysis tool, the columns need to be adjacent.
Charles
Hello
Thank you. I ended up rearranging my spreadsheet for this so it would work. It’s still so much easier than doing it one by one in SPSS!!!!
Thank you for a great resources
Stuart,
Thanks for your support.
Charles
Just a short question on the calculation steps for the confidence intervals:
in the calculation of “d” the equation doesn’t seem to solve correctly. I get the idea of df(E) = (n-1)(k-1), but the rest of the numerator is still different: (ICC*v+u)^2 = (k*ICC*v+u)^2
Which side of the equation would be the correct one?
Thank you for your help!
Beni,
There is a typo in the formula. Thanks for bringing this to my attention. I have now corrected the formula on the website.
I really appreciate your help in improving the accuracy of the website.
Charles
Hello Professor,
Thanks dor the explanation of ICC.
Statistics is difficult fo me to understand. I’m looking for a little more help here.
I want to determine the reproducibility and reliability of images. The images are greyscale images obtained from measurements. The image can thus be converted into gray values for each point of the image. I want to determine the reproducibility of the image so that it can be compared with following measurements.
If I understand it correct. In this case, is every new measurement a rater of the image?
And I think I should determine the ICC value for reproducibiliy? But I can not find a good example for this. (Where the x an d y are used as a coordinate system for the gray value of each pixel point).
I am struggling to figure out how to handle this.
I hope you can help me a little bit?
Thanks in advance.
With kind regards,
Chantal
Chantal,
Here are two studies that might be helpful
https://www.ncbi.nlm.nih.gov/pubmed/26614235
https://www.hindawi.com/journals/ijbi/2010/618747/
Charles
Hi Charles
Thanks alot for this post!
Could you explain why you use the two-factor ANOVA test in this case? This still has me a bit confused?
THANKS!
Michelle,
This is how the ICC is defined. Nothing magical about it.
Charles
Hi,
If I wanted to do an ICC for dichotamous (YES or NO) data with multiple raters (ie >2), how would I set this up in excel. It will be a ICC2,1. I was thinking:
Tester 1 Tester 2 Tester 3 Tester X
Scenario 1 1 0 1 1
Scenario 2 0 1 1 1
Scenario x 1 1 1 1
Where 1 = yes and 0 = no.
Or is there a better way to do this?
Thanks
Mendel,
This looks correct.
Charles
Thanks for replying so promptly.
I did this but got what I feel is an erroneous result. The ICC is 0.5 CI (0.22-80) with alpha =0.05.
There were 10 scenarios and 5 testers. In the first 9, all 5 were in agreement for each scenario (all chose YES), while in the last scenario, 2 chose Yes and 3 chose NO. Surely there is more than “moderate reliability” which such levels of agreement?
Thanks
Mendel,
Yes, this is the value you get. It also doesn’t seem very representative of the situation. For the type of ratings that you have, ICC doesn’t seem like the right approach since you really have categorical data. The usual test in this case is Fleiss’ kappa. It too will give a pretty disappointing result of kappa = .47. In the extreme cases these approaches don’t yield great results.
While I don’t recommend shopping around for a test that gives results that you like better, in general I find that the results from Gewt’s AC2 and Krippendorff’s approach are more representative of the situation. I would use ICC with continuous data (decimal values).
If you use Gwet’s AC2 for categorical data you get a value of .93 and a confidence interval of (.76, 1).
Charles
Hi Charles,
Could you clarify what you mean by ‘in the extreme cases’ in your comment above please? I have a similar situation to Mendel and I am wondering how to justify not using using kappa.
I also have data for 2 raters rating studies for a meta-analysis on a 10-item measure of study quality (higher total scores reflecting higher quality). Each item in the measure is yes/no (0 or 1 points for whether or not the study meets the quality criterion). Is it meaningful to enter the total scores into an ICC (2,1)?
Thank you very much.
Samantha,
If you enter the total scores you will only have two measurements: one for each rater. ICC won’t be able to do much with this.
For this situation, it sounds like Cohen’s kappa will be a good fit: two raters, categorical data.
Some of these interrater measurements give low rating even when there is almost perfect agreement. This what I meant by”in extreme cases”. As long as you don’t have close to perfect agreement, you should be ok.
Charles
Hi Charles,
Wonderful Article, thanks. Please correct me Where I am wrong.
So
ANOVA without Replication (Repeated measure) Feeds into K=1 of ICC ie (x, 1)
ANOVA with Replication (Repeated measure) Feeds into K=2 or more for ICC ie (x,k).
This takes the average scores of the same rater when calculating ICC.
Whenever I run a ICC (2,1), I can still choose an Option for K>1, how does the Software calculate the average of scores of (replication) when there is no replication? and is this result meaningful?
Thanks in advance
Marion,
See the following webpage regarding two factor Anova without replication:
Two factor Anova without replication
Charles
Hi Charles,
I am wondering whether it is possible in your example to obtain an ICC for each individual wine, or only as a whole?
I ask because I have a situation where 4 raters have each rated the frequency of displayed behaviours over a certain time period following guidelines on how to code each behaviour as present. It would be nice to have an ICC for each behaviour but as I understand it I would need two cases to be compared in order to compute the ICC value?
Thanks,
Joe,
I don’t know a way to calculate the ICC for each wine.
Charles
Hi Charles, thanks for this resource, it’s an interesting read!
I’m designing a self-report assessment of behaviours where I ask people to assess their behaviours on a scale from 1-5 on how frequently they perform each of 87 behaviours, and their manager then fills out the same assessment for them. I want to know to what extent self and manager ratings are consistent. Do you think ICC would be a good measure for this?
Thanks!
Della
Della,
ICC could be used as well as some of the other measures (e.g. Weighted Kappa, Gwet’s AC1/AC2 or Krippendorff’s Alpha).
Charles
Dr. Zaiontz
Thank you for making this type of analysis accessible.
I am a Lean Coach for a manufacturing plant. I am considering using the ICC in this case:
We have identified a set of 10 behaviors that we want to physically demonstrate at each morning team meeting. I plan to observe once per day for 1 week. For each of the 10 categories, I will sum the observations (1 for “observed”, 0 for “not observed”). This will make a value from 0 to 5 for each category.
At a future date, I will observe again for 5 days, and sum the observations. The purpose is to determine if we are sustaining the desired behaviors. I believe I can use the ICC to compare the BEFORE and AFTER categorical values. Higher ICC means behaviors remain “status quo” (as BEFORE). Lower means that “things have changed”.
My question is:
Is summing the observations an appropriate way to obtain a higher rating for “better / more consistent” behaviors?
The original observation sheet had a scale from 0 – 3. Where 0 = “No Observation” and 3 = “Does consistently”. This is my attempt to obtain a synthesized rating for the observational categories.
Brian,
I don’t see any problem with summing the daily values.
Generally ICC is used to compare different raters; your approach seems to make sense, but I haven’t thought about it enough to see whether you might be violating some ICC assumption. the following article might be helpful.
http://www.sciencedirect.com/science/article/pii/S0093691X10000233
Charles
Hi
I have a question I hope you can help me with. I am trying to measure the reliability of a new test that my physiotherapists will later use to measure if the subjects (patients) are getting stronger after going through a training program. The patients are instructed to jump in a certain way, and the distance is measured in cm. We will measure once before and once after having gone through the training programme.
To begin with, i need to know how much better the patients need to be, to be certain that I will later be able to get a significant result. I have ten physiotherapists who will later measure one or more patients each. It could also be that later one patient will be evaluated by two different physiotherapists , i e one who measures the before value and the other measures the after value.
To assess the reliability I am planning to start off by letting each physiotherapist measure one patient’s performance with the same test a couple of days apart.
1. How can I calculate the difference needed in cm:s to be sure that there is an actual improvement?
2. How can I construct a test to be used later on, to assess the variability/reliability over time? (I e to be used once every year to see if the test is still reliable enough?)
I have been looking at coefficient of variation, which seem irrelevant since my tests are paired and interpatient variability probably is bigger than intrapatient variability. Someone mentioned ICC, but I’m not sure how ICC can answer my first question.
It seems however that I can use the ICC to measure the reliability over time? That is, I calculate the different ICC:s now, and later on I can see whether the correlation stays equally high from year to year?
Please excuse any typos, English is not my mother tounge, nor is Statistics as it turns out 🙂
Best regards Elisabet
Elisabet,
1. To see whether there is a significant improvement in before/after studies, generally a paired t test is used (or a Wilcoxon signed-ranks test if the assumptions for the t test are not met.
2. This really depends on what you mean by “reliability”. ICC and similar measures capture whether two or more raters tend to agree on a rating.
Both of these topics are covered in some detail on the Real Statistics website.
Charles
Thank you so much for your quick response!
1. Yes, the t-test will be good for later use, when calculating if there is a significant difference. My question now however is if I a priori can get a hint of how precise the measurements have to be (how much I have to decrease the variability) or how big a difference in centimetres the improvement for each patient need to be. Kind of like it is done when calculating the sample size needed to get a specific power, only now I know the sample size and would like to know the estimated difference needed.. For now I think about using your table for sample size calculating “backwards”.
2. Good question. I would like to measure the reliability=conformity between judges as well as reliability =consistency of test retest for the same patient. If I understand you correctly, the ICC is no good in the latter case? Can I estimate the test-retest reliability some other way?
Thank you so much again!!
Elisabet;
1. When you say that you want to determine “how big a difference in centimetres the improvement for each patient need to be”, it would be helpful to understand how big this improvement needs to be “in order to do what or achieve what?”
2. In general, you can estimate test-retest reliability by using Split-half or Cronbach’s alpha, but I can’t say whether this is suitable in your situation.
Charles
Could you help me understand that it shows “Using these formulas we calculate the 95% confidence interval for ICC for the data in Example 1 to be (.408, .950) as shown in Figure 3”, while in the excel L42/lower=0.434, L43/upper=0.927? Does that mean there are further calculations afterwards to get the 95% CI? Many thanks!
No, there is simply a typo. The confidence interval should read (.434, .927). I have now changed the webpage to reflect this.
Thanks for identifying this problem.
Charles
Thanks!
Hi Charles,
Thanks again.
How would we calculate a p-value for this?
Thanks
Paul,
If you are referring to the C(3,1) example, then I believe that it is the value in cell L23 of the Figure 5, although I am not 100% certain of this. This is different for the C(2,1) example.
Charles
Yeah I’m not sure either. I know that’s the p-value for the ANOVA, but I don’t know if that would also be the p-value for the ICC. Anyway, confidence intervals apparently are more informative than p-values, so maybe I’ll just stick with reporting that.
Hi,
Would it be possible to obtain this excel sheet so I don’t need to enter these formulas by hand?
Thanks
Paul,
Yes, please go to the webpage Download Workbook Examples.
Charles
Hi Charles,
Thank you for this excellent resource.
My question relates to converting scores to a composite score. For example, within a category I have 3 questions –
Category – Information
Q1 – Quality of information
Q2 – Quantity of information
Q3 – Presentation of information
Each of these questions are assessed based on a likert scale from 1-5. Can I use a mean of the 3 scores or would that not be methodologically sound?
Thank you!
Batul,
That approach seems reasonable, but, of course, it really depends on what you plan to do with the composite score.
Charles
Hi Charles,
I want to use the composite score to calculate the ICC between 4 raters.
Batul.
Hi Charles,
Our research team is trying to determine how to establish inter-rater reliability for a records review process we are undertaking. We have approximately 400 records and want to reliably review them to assess for experiences of adverse events, some of which need to be extrapolated from notes, evaluations etc. such as the experience of neglect.
To establish inter-rater reliability is there a gold standard number of records, or statistic to determine necessary sample size, we should all review to establish reliability? Also, is the intra-class correlation coefficient the appropriate statistic to be using in this case?
Thank you,
Vamsi Koneru
Vamsi Koneru,
You can determine the sample size required using the Real Statistics Power and Sample Size data analysis tool, as described on the website.
Charles
Thank you for your response, I will use this tool on the website. For our purposes, is the ICC the appropriate statistic to use?
Thank you, Vamsi
Vamsi,
You haven’t provided enough information to enable me to comment on whether the ICC is the correct statistics to use. In any case, the referenced webpage does provide information to help you determine whether this is an appropriate statistic to use.
Charles
Thanks for your response. Would you please let me know what other information you would need to determine if the ICC is the corrct statistic to use?
Thank you, Vamsi
Dear Charles,
I am wondering if ICC is the correct method of testing inter-rater reliability if you have 2 raters evaluating the same people using a continuous (count) variable. Each reviewer watches a video of the same people and counts the number of times they blink in 30 seconds. You never seem to get exactly the same count but they are close. Should we be using ICC to test inter rater reliability here or something else?
Thanks
Keith,
There are many other rating approaches out there, but it seems that ICC could be used.
Charles
Charles,
Thanks. I will try ICC. Is there a better one that you might know of? I cannot find any specifically addressing the issue of continuous ratings. Most are based on discreet choices (like Cohen’s Kappa) or are Likert scale based.
Thank you again for your assistance.
Keith,
Some use Krippendorf’s Alpha (https://en.wikipedia.org/wiki/Krippendorff%27s_alpha), but ICC is a good choice.
Charles
Dear Charles,
On a wine tasting of 10 wines by 11 tasters, I found
ICC(2,1)=0.20 with confidence interval (0.07:0.54) and ICC(2,11)=0.74 (0.46:0.93)
The low value for ICC(2,1) seems to suggest a very poor correlation for the individual scores, whereas the ICC(2,11) value and the confidence interval seem to tell me that the reliability of the average of the 11 scores is not too bad.
Can you help me with the interpretation of this apparent contradiction?
Thank you,
Erik
Erik,
This is discussed on the webpage https://real-statistics.com/reliability/intraclass-correlation/intraclass-correlation-continued/. It depends on which measure is closer to your needs. The ICC(2,1) measurement is the one that is most commonly used.
Charles
Hello Charles,
I am looking to find the ICC for a dataset where each of three judges rates each subject three times. Additionally, the ratings are binary. What changes would you suggest to be able to calculate a valid ICC?
Thank you,
Paul
Hello Paul,
Maybe I am missing something here. Why would each rater rate the same subject multiple times? Wouldn’t the rating be the same each time?
Charles
Hello Charles,
The ratings of a given rater can differ for a given subject because some of the subjects do not fall into either category perfectly, so it could be possible to rate the subject differently across repeated ratings. If people’s judgement was perfect each time, this variability wouldn’t arise, though. The design of the experiment, with multiple raters and multiple ratings of each subject, is similar to the design described in a paper posted elsewhere in these forums:
http://ptjournal.apta.org/content/74/8/777.short
Thank you,
Pawel
Hello Paul,
From what I see from a quick reading of the abstract of the referenced article, the ratings may differ because additional information is gained over time.
Unfortunately, I don’t have enough time now to delve into this issue further.
Charles
Dear Charles,
I have four raters that have rated 80 different companies on several different variables in a survey. Most variables consist of several questions combined to create the given variable. Each rater rates different companies and a different number of companies, i.e. one rater did cases 1 to 20, 2nd rater companies 21 to 35, 3rd rater companies 36 to 41 and the 4th rater companies 42 to 80. For example purposes, one of the variables being asked of in the survey is HPWS. I created a mean to create the HPWS from all the questions regarding HPWS in the survey. I then try to run ICC in spss creating four columns, one for each rater. I then put the mean number acquired for the companies rated by the raters under the appropriate column. However, what is different is that each company is rated only by one rater. My results are not positive needless to say. Am I missing something. Can I not run ICC for some reason?
Nicole,
I haven’t completely followed what you did, and perhaps I am missing something, but I don’t see how you can get anything meaningful if each company is rated by only one rater.
Charles
Okay, yes. This is what I was thinking. You can only compute ICC to determine agreement between raters if the raters are rating the same case, correct?
Nicole, that is correct.
Charles
Thank you so much for a terrific resource!
At the very top, you say “We illustrate the technique applied to Likert scales via the following example.” What if the scale is not Likert? Additionally, what if each rater is from a different company and their group uses an entirely different scale? What’s more, what if five different raters using five widely different scales or measurement or
grading also look at different criteria in order to come up with a “final grade”? There is surprising little reading material out there when it comes to scales that differ and scoring methods/criteria that differ. In my example, one rater may use a ratio scale that can go negative, like +100 to -100 and another just ranks in an ordinal rank order, and another may have a scale that is 1,800 down to 50.
I am trying to determine if one or more raters deviate from “assumed positive correlation” from the other rating groups (group movement overall consistency even if the row item variation is very extreme for each row item). Even with all the differences of rating and scales, I assume the various raters “have their rankings in a similar order” at the end of the day. The “between group” variation is very large on any one row item but the groups should rank each row item fairly consistently. I know the Kendall W can be used with three or more raters but can the scales be vastly different one rater to another? Would ICC work here? I thought about converting each group to a rank order but have not done so yet; I don’t think you can use ICC if you convert to ranks, true?
Thank you very much!
Kirk,
Some clarifications:
1. ICC can be used with non-Likert data. It is only the example that uses Likert data. ICC requires interval or continuous data. In the example Likert data is treated as interval data.
2. ICC can handle the case where one rater tends to be more severe than another and so give fewer higher scores, but I would doubt that it handles situations where one rater rates from 1 (low score) to 10 (high score) and another from 100 (low score) to 1 (high score). Do you really have a situation where this can happen?
The following website may be helpful:
http://www.ncbi.nlm.nih.gov/pmc/articles/PMC3402032/
Charles
Hello Charles,
Great site, thanks for trying to help us non-stat gurus understand this field. I have heard varying opinions on whether the ICC can be used for “Intra-rater reliability” rather than “Inter-rater reliability”. In other words, can ICC be used if there is just one judge who makes multiple (repeated) measurements on a number of subjects (in effort to demonstrate repeatability/reproducibility of the measuring tool)? If not, which test to do you recommend? (measuring intestinal length using a 3D software on 50+ patients, just one reader though). Thanks in advance for any advice!
Chuck,
ICC isn’t used if there is only one judge.
Since there is only one judge but multiple patients, I would expect that most the variability would relate to the differences between patients, which could be measured by the variance or standard deviation. I am not sure how you would squeeze out the variability due to the judge’s inconsistency in measuring (if indeed this is what you are interested in).
In any case, here are some other measurement techniques which may or may not be relevant to you: Bland-Altman, Cronbach’s Alpha, Gage R&R. All are described on the Real Statistics website (just enter the name in the Search box).
Charles
Hi Charles,
First of all thank you for your down to earth explanations. I do have a question. Can you do ICC on just one item for 5 raters/judges? SPSS seems to prevent you from doing that.
Any guidance will do.
Thank you.
Ray,
No. With only one subject ICC doesn’t really have any meaning.
Charles
I think this site is a wonderful resource, therefore I hope you dont mind some naive questions since I think I am on the cusp of understanding, but not quite there.
The actual value generated for the wines example:
ICC = 6.15/(6.15 + 2.28 + 0.02) = 0.728
what in layman’s terms might figure 0.728 represent ? (the wine testers had slightly/fairly/very homogenous opinions)?
Also, of the judges, judge b appears the most iconoclastic. But is there some measure whereby a judges mark could be compared to the others at which point it might be possible to make the conclusion that it goes beyond iconoclasm: namely (a) they know nothing about wine, or (b) they were actually judging different wines?
Similarly is there a standard numerical way of quantifying the level at which any wine might be said to generally ellicit divergent opinions (you either love it or you hate it)?
I suppose what I have difficulty with (owing to a lack of background in statistics rather than any lack of clarity in the site) is how to map a number of the terms you mention here, with the concepts I am interested in: namely measuring the homogeneity of a group of judges, the pattern of any particularly judge (compared to the others), and the degree to which a subject (in this case wine) tends to ellicit convergent or divergent opinions.
Two final simple questions – if there were two criteria for each of the judges when evaluating wine (e.g aroma and body) and there were therefore 2 scores from each judge per wine, would that affect how one went about using ICC. Also, if the judges were not that conscientious and forgot to record scores for some of the wines, would that affect the excel procedures?
Thanks anyway, for a wonderful site
Steve
Steve,
I actually have many of the same questions as you regarding ICC. It is not always clear how to interpret these measurements. If ICC is .9 then it is easy to see that it is high, but it is not so easy with lower values. The following website provides some guidelines, but I am sure that not all statisticians would agree with these guidelines. In any case, the article may be useful.
http://www.ncbi.nlm.nih.gov/pmc/articles/PMC3402032/
Regarding what to do when there are multiple criteria (eg aroma and body), you could create a composite score and calculate ICC on the composite score. Alternatively, you could calculate two ICC measurements based on each of the criteria. Since ICC is based on ANOVA you create a new ICC measurement based on an ANOVA model which takes both criteria into account (I have not tried to do this).
Charles
Dear Charles!
Thank you for your article. I am also very happy that seemingly the Q&A is still viral.
I would like to ask for your help as well.
I would like to determine the test-retest reliability of certain biomechanical parameters of a person’s postural stability.
The person was measured six times in bipedal stance eyes open and closed conditions, furthermore in a single limb stance. The measured parameters are usually differ in these conditions.
In my ICC analysis I considered the six trials as the six judge and the types of stance as 3 subjects. I committed the analysis separately for each parameters.
Do you think this approach is correct?
I have read in a study that they averaged results of trials thus increased ICC. In my case this would reduce judge number by the averaging number. What do you think of this approach? What is the importance of judge number?
Thank you for your answer in advance!
Gergely
Gergely,
Sorry, but I really don’t have enough information to answer your question. If the trials are done by the same person then the results won’t be independent which may defeat the purpose of the ICC analysis.
Charles
Hello sir,
Can you please help me with my inter annotator agreement? I want to compare two versions of a codingmodel, which contains 30 categories. My material is based on 39 different instructions. How can i best use the Cohen’s Kappa?
Joyce,
The following webpage shows how to do this:
https://real-statistics.com/reliability/cohens-kappa/
Charles
Hi,
I wonder whether the within subject standard deviation (Sw) can be calculated provided that the published article only provides the ICC value as well as the mean and SD for each of the replicated measurements?
Let’s say a study says that the intra-observer ICC of a thickness measurement is r=0.99 (one observer has repeated the thickness measurement on 10 subjects). It also provides the mean and SD for each of the repeated trial as:
Trial 1: Mean :361.95 SD=88.84 n=10
Trial 2: Mean:364.44 SD=92.84 n=10
Thanks
Hosein,
Sorry, but I am not sure which measurements you are referring to. In any case, ICC = var(b)/(var(a)+var(b)+var(e)). If you want to find the value of var(e) then you need to know the values of ICC, var(a) and var(b). You have the value of ICC, and so you need to know the values of var(a) and var(b). Now, var(b) = (MSRow-MSE)/k. It sounds like you have the values of MSRow and k. Thus var(b) has a value which depends on MSE (which is the same as var(e)), which means that so far you would need to use some algebra to solve for MSE. Finally, var(a) = (MSCol – MSE)/n. It sounds like you have n, but I am not sure whether you also have MSCol, in which case you won’t be able to find var(a).
Charles
hi Charles,
i am a person who understands very little of statistics, but am doing a research. my research is on 4 different formulae and if they could predict birth weight of the fetus accurately before being born, i compare this to the actual birth weight after birth.
i have arrived at the following table, can you please explain to me what i should infer from it (what does it mean)
Equations used – Intra Class Correlation -95% of ICC
Buchmann – 0.698 -0.599 to 0.769
Dare’s – 0.656 -0.419 to 0.777
Johnson’s – 0.682 -0.557 to 0.764
Hadlock’s – 0.607 -0.096 to 0.794
thanks
Sorry, but I can’t decipher the table. Presumably the names are the names of the raters. I can’t tell what the first number in each row represents. The next two numbers appear to be some sort of confidence interval.
Charles
Hello Charles
I am doing an analysis on coal ash. How it is done is that, a lab receives samples from the source A to do a precertified analysis and another sample from the source B to do a verification analysis. The analysis is done in replicates i.e there will be two results which are then averaged to have one number. I want to assess the variability between the replicates and the the average for Precertified and verification, as they are assumed to come from the same coal stockpile. I want to use ICC but not sure whether to use the ICC1 or ICC3. At the end i need to check the variablity between Precertified and verification as well as variability between rep 1 and rep 2 from both Precertified and verification. Kindly assist. thanks D
Sorry but I don’t completely understand the situation. What is playing the role of rater in this situation? Are you taking two replicates from source A and averaging them and also taking two samples from source B and averaging them? Does this mean that you have a total of 4 coal ash measurements? I am confused.
Charles
Hi Charles,
What does a 95% confidence interval for an ICC value physically mean? Could it be that you can have a 95% confidence in that ICC when it lies between the lower and upper limit? And why is there an upper limit? I would expect that the higher the ICC value the better. There is clearly something I do’nt understand.
By the way, I recalcalulated withe Excell the whole example 1 (4 judges, 8 wines) and want to report that in the formulas for g and h, I had to utilize the F.INV.RT function instead of FINV.
Thank you for answering. Your site is a great help for me
Erik
Erik,
Good to read that the site has been a great help.
A 95% confidence interval has the same meaning for ICC as for any other statistic. You can think of it as meaning that you can have 95% confidence that ICC lies between the lower and upper limits (although the actual meaning is a little more complicated). Even when the higher the ICC the better, there is still an upper limit.
F.INV.RT and FINV produce the same results. I have used FINV since Excel 2007 users don’t have access to the newer F.INV.RT function.
Charles
Charles,
Two more questions:
1 I held a wine tasting (n=k=7) and found ICC(2.1)=.449 (alpha 5%;.171-.823) and ICC(2.7)=.851 (5%, .590-.970). The ICC values are situated within the confidence interval and are thus not significant. I need a help to to interprete this conclusion. Which are the null and alternative hypotheses of the test?
2 What do you think of taking extreme looking scores for one or more wines out of the test?
Thank you again,
Erik
Erik,
1. The null hypothesis is that the population ICC = 0.
2. As long as you report that you have done that, I don’t see any problem with it.
Charles
Hi,
I need a help.
I do not know of this test is suitable for my situation or not.
I have 428 texts that are annotated by numbers 1,2,3,…,428 and I applied a sentiment analysis on these text and the results were positive 1 or negative -1 or 0. This analysis applied in two versions one in arabic texts and the other one translated English. So, I have two row contain the result of sentiment in each case. In this case, I can use Kappa I think.
However, In addition for that , I have 3 extra rows from 3 different annotators. I want to measure the similarity between these 5 rows. Is this text suitable for my case.
Thanks in advance.
If I understand things correctly, essentially you have 428 subjects to rate, 5 raters and ordered ratings. This is usually a good fit for Intraclass Correlation. The only problem is that you only have three ratings: -1, 0 and 1, and so I am not sure how robust the Intraclass Correlation in this case. Another possibility is Krippendorff’s Alpha, but I can’t recall whether this measurement has the same limitation.
Charles
Thank you for replying, My reaponse is between -1 to 1. So, the values are continuous between them. However, I used the ICC between 3 responsed and I got a negative value! and I read that ICC cannot be a negative value !!
but when I calculate it with all response I got 0.05 ? Is this relevant results
Without seeing your data I am not in a position to answer your question..
Charles
Hi Charles, may I apply ICC to the following scenario.
I set up a test that asks observers to look at pictures of two lines arranged perpendicular to each other, their task is to guess the how much the horizontal line measures as a percentage of the vertical line. I have measured the lines so I KNOW the correct answer.
I wish to analyse:
1. whether the observers agree with each other for each picture and whether this is statistically significant.
2. how far the observers deviate their scores from the true measurement and whether this occurs at certain horizontal:vertical length ratios.
As I understand it, all the observers must score the exact same slides and are randomly selected.
My main problems are:
1. Will ICC help answer the above questions.
2. How many slides are needed in the test to power the study p=0.05?
3. How many observers are needed to power the study for p=0.05?
Luckily I can create any number of slides and have the liberty to select up to 15 observers.
Any help would be much appreciated.
-YH Tham
PS the observers are given the following options to choose from 0%, 25%, 50%, 75%, 100%, 125%, 150%, 175%, 200%.
YH Tham,
1. I understand from “all the observers must score the exact same slides and are randomly selected” that all the slides are rated and that all the slides are rated by the exact same raters (who are randomly selected from a population of raters). If I understand this correctly then ICC class 2 can be used. (If different raters are randomly selected to rate the slides then ICC class 1 can be used.)
2. I don’t know of a way to calculate the power or sample size for ICC class 2. I can calculate the power and sample size for ICC class 1, but this approach is not applicable to class 2. I know that the ICC for class 1 is always less than or equal to the ICC for class 2.
3. I believe that the more observers (raters) the fewer slides need to be tested, but I can’t give any exact figures.
Charles
Thanks Charles, forgive me, I’m a little new to this. I’m not sure I understand.
As per my scenario:
I can create a bank of 300 slides (designated slide 1, slide 2, slide 3 etc up until 300). For each slide, I know the answer as I have measured the horizontal and vertical linear ratios. From this bank I can randomly select slides to create a test with ‘n’ number of slides.
I can also select ‘x’ number of observers/raters randomly to take a test. I have the ability to create a different test for each observer, or I can use the same test on each observer. Which would you prefer to satisfy the criteria for ICC class 1?
I guess, the real question is what do I need to do in order to make it easy to power the study from an ICC class 1 perspective. Then what numbers of ‘n’ and ‘x’ do I need to satisfy a p<0.05?
Kind regards
-YH Tham
PS Furthermore, I’m not sure whether to call ‘n’ or ‘x’ (as described above) ‘sample size’.
YH Tham,
I use k to represent the number of raters and n to represent the number of subjects (i.e. slides) being rated.
All three ICC classes assume that each subject is rated by the same number of raters, but if the same raters don’t rate all the subjects then it is the class 1 ICC that is used. It is assumed that the raters for each subject are selected at random from a pool of raters.
You can’t tell in advance which values to use for k and n to satisfy p < .05. The value of p is calculated after you perform the test. Charles
Thank you Charles, I can’t tell you how much you help people with this website.
My problem still boils down to the same issue in the end, I have is how to justify the values selected for ‘k’ and ‘n’ and I am never sure how to go about it. How many would you suggest? and on what basis?
Sorry once more for bothering you again, I promise I will leave you alone after your next reply! 🙂
Perhaps I am not completely understanding the nature of the difficulty that you are having, but the key is to determine what are the subjects/entities that are being rated and who/what are the raters. I am using n = the number of subjects and k = the number of raters (that rate each subject).
Charles
Hi Charles,
Thank you very much for your amazing work.
I have got a problem here,
I have 62 questions and 100 respondents (responses are in the form of Yes or No). And if the response is ‘Yes’, there is a score for that (Score changes from question to question). And if the response is ‘No’, score is zero irrespective of questions.
I am not getting which test can I perform on this data to check for Reliability, Agreement among respondents(raters). And let me know if any other test possible on this data.
Please help me with this.
Thank you very much
Bharatesh R S
If I understand correctly, then there is a numerical score for every question, namely some (presumably positive) number if the person answers Yes and 0 if the person answers No. If your goal is to check whether the scores for the 62 questions are consistent across all 100 raters then it seems like the ICC should work fine.
Charles
Thank you very much Charles.
Hi Professor,
I wonder if there is a possibility to use weightened Kappa for multiple experts. (Fleiss’ kappa, but weightened). If yes, it is possible to weight it not linearly, but quadratic, or some other way. You probably might say, that ICC is more suitable here, but I have only 5 categories (categorial type of data 0-1-2-3-4 and I cannot change/extend the ratings scale), and the matter of fact that difference between 3 and 4 is quite big(by definition of the category) and I want it to be considered in the inter-rater analysis.
The following articles might be helpful. I have not read them, but they seem to be related to your question.
https://www.researchgate.net/publication/24033178_Weighted_kappa_for_multiple_raters
http://www.sciencedirect.com/science/article/pii/S1572312711001171
Charles
Charles,
Which ICC I must use? (which case?)
As exposed in Doros (2010) – Design Based on Intra-Class Correlation Coefficients, we have:
Case 1 – each target is rated by different raters
Case 2 – the same raters rate each target
Case 3 – all possible raters rate each target
similar in Shrout (1979)-Intraclass Correlations: Uses in Assessing Rater Reliability, page 421 after the table
I have 2 instruments (methods to measure), and I am measuring the RR intervals in a number of patients.
I also have to choose a random beat (heart beat) in each record, p.e. the beat 10 of each record, or choose a random number of beat in each record, p.e. choose 10 beats (2nd, 4th, 8th, 12th, …) in each record.
Do you agree with me with these identities or do you have another idea?
target = patient
raters = beat
judge = method
Paulo,
Sorry but I don’t understand your example. I didn’t define “target” and judge and rater are usually the same thing.
Charles
Hi Charles,
I have a situation that may be similar to Steve’s scenario above. In our scenario, two raters are judging the performance of 7 students over a 5 to 8 week period where they meet three times per week to discuss cases in groups. After the 5 to 8 weeks, each rater evaluates each student based on multiple qualities (how well did they listen, how well did they speak, how well did they show respect for others, etc.). I guess this would be like having the rater’s in your example rate the color, aroma, and taste for each wine rather than simply assigning a single number between 0 and 9 for how “good” the wine is. My question is…if each of the qualities is weighted equally, is it appropriate to use each students average score from each rater for the ICC or is there a different analysis that could be done to preserve this additional dimension of measurement?
Perhaps the following paper on multivariate ICC could be helpful:
http://files.eric.ed.gov/fulltext/ED038728.pdf
Charles
Hi there! my situation looks like this: Two groups of people A and B had two texts to rate: group A rated texts A1 and A2, and group B rated texts B1 and B2. There were 9 raters in group A and 7 in group B (but two of them failed to mark B2). I want to find the IRR of the marks that have been given by the raters. I have done the ICC for texts A1 and A2 and also for B1 and B2. Now I would like to do the same for texts A1 and B2, and A2 and B1, but spss won’t let me because the amount of raters in groups A and B is different. Any suggestions?? Thanks!
Marta,
I don’t know an accepted way of handling the situation with unequal number of raters. The following is a possible approach, but I have no experience as to whether this approach gives useful results or whether this approach matches your situation.
Suppose there are 9 raters for group A and 7 raters for group B and suppose that we can create an IRR measure if group A had only 7 raters (equal number of raters). Since there are C(9,7) = 36 ways of choosing 7 of the 9 raters, calculate the IRR measure for all 36 ways of 7 raters for A with the 7 raters for B. Then take the average of these 36 measures as your IRR.
Charles
What if there were multiple measurements per observer? Would you take the mean of each and proceed?
Steve,
If you follow this approach then you will be calculating a measurement of the agreement between raters of their mean rating. This may be sufficient for your needs.
If you want to take the multiple measurements per rater I would guess that you would need to use a version of ICC based on ANOVA with repeated measurements. Unfortunately I wasn’t able to quickly find a reference for this. Perhaps someone who is following this issue with us online has a reference.
Charles
I am struggling to understand how this provides a measure of reliability since the value seems totally dominated by the diversity of the population, as you mention above. If, for example, I have two sample sets on the same 5 point scale, and in one set the judges scored everything within a 2 point range (scores of 2’s or 3’s) and in the other set the scores covered the whole range, the ICC for the first set would be lower than the second set regardless of which sample set was scored more reliably.
Why I try to assess the reliability of the judges ratings using the Class 3 ICC I see consistent increase of the ICC, but again it doesn’t seem to correlate with what I would consider true reliability.
Thanks for you time.
Regards,
Christian
Hi Prof,
I seek your help regarding a repeatability test.
I’m conducting an experiment where there are 5 fixed examiners. The examiners will be required to plot on a software the thickness of a body tissue. On each body tissue sample, there will be 1000 points along the whole sample. The software will then generate the thickness of the 1000 points along the tissue.
I want to find the repeatability of these plots within the examiner himself and between the 5 examiners.
Is it right for me to use the ICC for the repeatability analysis?
I hope you can clear my doubts.
Thank you for your time.
Regards
Vincent
Vincent,
Repeatability refers to a single person/instrument measuring the same item repeatedly. This doesn’t sound like the situation that you describe. What you describe seems more like “reliability”. ICC can be used for this purpose.
Charles
And why is there a “AB21 +” in the denominator in AD26? There is no d in the equation for lower above.
Why is it in Excel equation AD24: AB23 for g? should it not be AB22 for d’ in the equation?
Thank you for the explanation!
Question: The left side of the formula for d= doesn’t match the right side. Seems to be a k missing in the denominator?!
I meant numerator…
actually the k should not be there on the right side.
Thank you for this wonderful explanation. How this ICC formula applies to the calculation of ICC for Hierarchical Linear Models or Mixed Models???
Trinto,
I have not yet included hierarchical models and mixed models in the website. I plan to this in the future.
Charles
Hi,
Thanks for this post!
I’ve got issues to understand the following sentences since judges E and F don’t exist. Moreover, the two sentences are in contradiction with each other… and with reality.
” var(ε): […] judge E finds wine 1 terrible, while judge F loves wine 1)”
” var(α): […] judges E and F both find wine 1 to be the best, but while judge E assigns wine 1 a Likert rating of 9, judge F gives it a rating of 6).”
Thanks for enlightening me!