Introduction
Cohen’s Kappa is a measure of the agreement between two raters, where agreement due to chance is factored out. We now extend Cohen’s kappa to the case where there may be more than two raters. This extension is called Fleiss’ kappa. As for Cohen’s kappa, no weightings are used, and the categories are unordered.
Formulas
Let n = the number of subjects, k = the number of evaluation categories, and m = the number of judges for each subject. E.g. for Example 1 of Cohen’s Kappa, n = 50, k = 3, and m = 2. While for Cohen’s kappa, both judges evaluate every subject, in the case of Fleiss’ kappa, there may be more than m judges, and not every judge needs to evaluate each subject; what is important is that each subject is evaluated m times.
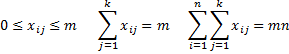
For every subject i = 1, 2, …, n and evaluation categories j = 1, 2, …, k, let xij = the number of judges that assign category j to subject i. Thus
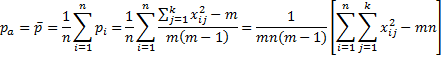
The proportion of pairs of judges that agree in their evaluation of subject i is given by
![]()
The mean of the pi is therefore
We use the following measure for the error term
 where
where

Fleiss’ Kappa and Standard Error
Definition 1: Fleiss’ Kappa is defined to be
![]()
We can also define kappa for the jth category by
![]()
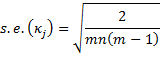
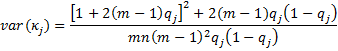
The standard error for κj is given by the formula
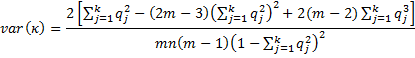
 The standard error for κ is given by the formula
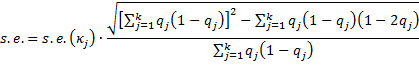
There is an alternative calculation of the standard error provided in Fleiss’ original paper, namely the square root of the following:
The test statistics zj = κj/s.e.(κj) and z = κ/s.e. are generally approximated by a standard normal distribution. This allows us to calculate a p-value and confidence intervals. E.g. the 1 – α confidence interval for kappa is therefore approximated as
κ ± NORM.S.INV(1 – α/2) * s.e.
Example
Example 1: Six psychologists (judges) evaluate 12 patients as to whether they are psychotic, borderline, bipolar, or none of these. The ratings are summarized in range A3:E15 of Figure 1. Determine the overall agreement between the psychologists, subtracting out agreement due to chance, using Fleiss’ kappa. Also, find Fleiss’ kappa for each disorder.

Figure 1 – Calculation of Fleiss’ Kappa
For example, we see that 4 of the psychologists rated subject 1 to have psychosis and 2 rated subject 1 to have borderline syndrome. No psychologist rated subject 1 with bipolar or none.
Other Formulas
We use the formulas described above to calculate Fleiss’ kappa in the worksheet shown in Figure 1. The formulas in the ranges H4:H15 and B17:B22 are displayed in text format in column J, except that the formulas in cells H9 and B19 are not displayed in the figure since they are rather long. These formulas are:
| Cell | Entity | Formula |
| H9 | s.e. | =B20*SQRT(SUM(B18:E18)^2-SUMPRODUCT(B18:E18,1-2*B17:E17))/SUM(B18:E18) |
| B19 | κ1 | =1-SUMPRODUCT(B4:B15,$H$4-B4:B15)/($H$4*$H$5*($H$4-1)*B17*(1-B17)) |
Figure 2 – Long formulas in worksheet of Figure 1
Note too that row 18 (labeled b) contains the formulas for qj(1–qj).
The p-values (and confidence intervals) show us that all of the kappa values are significantly different from zero.
Finally, note that in versions of Excel after Excel 2007, you can use NORM.S.INV instead of NORMSINV and NORM.S.DIST(H10,TRUE) instead of NORMSDIST(H10).
Worksheet Function
Real Statistics Function: The Real Statistics Resource Pack provides the following function:
KAPPA(R1, j, lab, alpha, tails, orig): if lab = FALSE (default) returns a 6 × 1 array consisting of κ if j = 0 (default) or κj if j > 0 for the data in R1 (where R1 is formatted as in range B4:E15 of Figure 1), plus the standard error, z-stat, z-crit, p-value and lower and upper bound of the 1 – alpha confidence interval, where alpha = α (default .05) and tails = 1 or 2 (default). If lab = TRUE, then an extra column of labels is included in the output. If orig = TRUE, then the original calculation for the standard error is used; the default is FALSE.
For Example 1, KAPPA(B4:E15) = .2968 and KAPPA(B4:E15,2) = .28. The complete output for KAPPA(B4:E15,,TRUE) is shown in Figure 3.
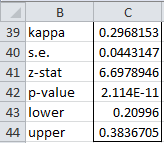
Figure 3 – Output from KAPPA function
Data Analysis Tool
Real Statistics Data Analysis Tool: The Interrater Reliability data analysis tool supplied in the Real Statistics Resource Pack can also be used to calculate Fleiss’s kappa. To calculate Fleiss’s kappa for Example 1, press Ctrl-m and choose the Interrater Reliability option from the Corr tab of the Multipage interface as shown in Figure 2 of Real Statistics Support for Cronbach’s Alpha.
If using the original interface, then select the Reliability option from the main menu and then the Interrater Reliability option from the dialog box that appears, as shown in Figure 3 of Real Statistics Support for Cronbach’s Alpha.
In either case, fill in the dialog box that appears (see Figure 7 of Cohen’s Kappa) by inserting B4:E15 in the Input Range, choosing the Fleiss’ kappa option, and clicking on the OK button. The output is shown in Figure 4.
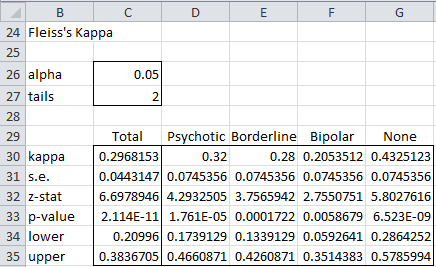
Figure 4 – Output from Fleiss’ Kappa analysis tool
Note that if you change the values for alpha (cell C26) and/or tails (cell C27), the output in Figure 4 will change automatically.
Examples Workbook
Click here to download the Excel workbook with the examples described on this webpage.
Links
References
Cardillo, G. (2009). Algorithm for Fleiss’s kappa, MATLAB
http://www.mathworks.com/matlabcentral/fileexchange/15426-fleisses-kappa/content/fleiss.m
Wikipedia (2013) Fleiss’ Kappa
https://en.wikipedia.org/wiki/Fleiss%27_kappa
Hello Charles,
thank you for your great work in supporting the use of statistics. It already helped me a lot 🙂
I tried to use Fleiss Kappa from the Real Statistics Data Analysis Tool. But it won’t work for me. I Always get the error #NV, although i tried out to Change things to make it work.
In my study i have three raters that rated students perfomance on the one hand with a dichotomous questionaire (yes/no) and on the other hand there was a Likert Skale (1-5) questionaire. For both questionaire i would like to calculate Fleiss Kappa. But both won’t work. I already deleted the rows when there was one rating of the 3 raters missing. But i still get the same error.
What am I missing?
If you email me an Excel file with your data and results, I will try to figure out what has gone wrong.
Charles
Hi there. I also had the same problem with results coming out as errors. I’m not great with statistics or excel but I’ve tried different formats and haven’t had any luck. Did you find a solution for the people above?
Hello Suzy,
Yes. The correct format is described on this webpage, but in any case, if you email me an Excel file with your data, I will try to help you out.
Charles
there is a problem with the B19 cell formula. I tried to replicate the sheet provided by you and still am getting an error
I just checked and the formula is correct. It works perfectly well on my computer.
What error are you getting?
If you email me an Excel file with your data and results, I will try to figure out why you are getting an error.
Charles
Thank you for these tools. I keep getting errors with the output however. I am trying to obtain interrater reliability for an angle that was measured twice by 4 different reviewers. I tried to use fleiss’s kappa but i wasnt sure how to structure the array. Either way, when I select 4 columns of data, I get an alpha of 0.05 but the rest of the table shows errors (#N/A). Any suggestions?
Hi Frank,
If you email me an Excel file with your data and output, I will try to figure out why you are getting these errors.
Charles
Please let me know the function in the cell “B19”.
Thanks, Takafumi
Sorry. I found the function.
What does “$H$4” mean? Just the calculated value from box H4? Thank you!
H4 = the number of raters (psychologists in this example)
Charles
Is there any form of weighted fleiss kappa?
Hello Chris,
I don’t know of a weighted Fleiss’ kappa, but you should be able to use Krippendorff’s alpha or Gwet’s AC2 to accomplish the same thing.
Charles
I would like to ask your assistance as i am trying to work on the inter-agreement of the rater on the items of the questionnaire. Following your formula of the Fleiss Kappa, but i cannot continue because of the command in the excel: =1-SUMPRODUCT(B9:B44:$H$9-B9:B44)/($H$9*$H$10*($H$9-1)*B46*(1-B46))…which is to get b, is not working. What can possibly wrong?
=1-SUMPRODUCT(B9:B44,$H$9-B9:B44)/($H$9*$H$10*($H$9-1)*B46*(1-B46))
this formula is to get the k…adopted from yours but the response is there is problem
Hello Melanie,
What is the reported error message or other indication of a problem?
Charles
Hello!
Thanks so much for this helpful tutorial. I am currently conducting research in which 10 raters evaluate a surgical training questionnaire. The raters select all themes that apply to a question (themes include: “blood supply”, “leg anatomy”, etc.). So, 10 raters can answer that a question addresses blood supply and nine raters can say that same question addresses flap reach. My current data sheet looks exactly like the one included as an example on this page, except the raters can select multiple diagnoses. I suspect that this affects the value of m in this scenario.
Do you have any advice on how to proceed from this point?
Hello James,
This a great question, and I have tried to find an approach using existing techniques that I am familiar with to come up with a solution. The best approach that I can think of is to use Kendall’s W. If say there are 5 categories, then each rater gives a score to all the categories making sure that the sum of the ratings adds up to 1+2+3+4+5 = 15. Thus if a rater chooses only blood supply, he/she would give 15 points to blood supply and 0 to the other categories. If instead the rater chooses blood supply and leg anatomy, then he/she could give 7.5 points to each of these categories and 0 to the other categories (or if blood supply is more important, say 9 to blood supply and 6 to leg anatomy).
See Kendall’s W
Charles
Hello Charles,
Thank you for this great tool.
I would appreciate your help in interpreting some of my Fleiss kappa results. Here is a link to my sample excel sheet on Dropbox https://www.dropbox.com/s/irbrne86xq51970/fleiss-kappa-case1.xlsx?dl=0
I have three annotators judging 597 question-answer pairs. Each answer can be judged as “direct”, “indirect”, or “incorrect” answer. The kappa scores that I got for kappa-all, kappa-direct, kappa-indirect, and kappa-incorrect are 0.383, 0.586, 0.292, and 0.1521, respectively.
My question is: how can I interpret the relatively higher kappa score of 0.586 for kappa-direct. This phenomena of having the highest Fleiss kappa for kappa-direct is prevalent in any sample that I take out of my 2064 question-answer pairs. Please refer to the excel sheet in the link above for the kappa function parameters.
Thank you
Hello Rana,
Kappa-direct has the most agreement, and even this is not very high. The agreement among the others is quite low.
Charles
Dear Charles,
Thank you so much for this wonderful tool! I am finding a lot of useful explanation here but I seem to get more confused every time.
I have sets of medical images with 6 different features (thick borders, nodules, nests…). Each image is graded by the same 4 observers and they need to say whether or not they see the features in the images.
I have 22 images, 6 features (present/absent) and 4 observers.
From what I understand, categorical data (yes-no) and multiple raters calls for a Fleiss Kappa. I get 6 different kappa values, each assessing how strong my criteria is in my images. (Is that right)
Then I repeat the same test with a different group of graders (students vs teacher) and I want to see which group is the best at identifying features. This is where it gets confusing for me.
Thanks so much in advance for your help and for putting together this amazing website.
Hello Sabrina,
Glad that you are getting value from the website.
Yes, you are correct: you can calculate 6 kappa values, one for each feature. If you code all the features together (e.g. number of features found, which is a number between 0 and 6), then you would have one value for kappa. This may or may not be helpful, depending whether the particular coding meetings your needs.
Now let me try to answer the question you asked. The value of kappa simply tells you whether the original 4 observers tended to agree. This may or may not be useful in your task of comparing teachers with students. You still don’t know for sure what the “gold standard” is for this identification task. If, for example, you see that the 4 observers are largely in agreement and these observers are considered experts, then you can use their results to set the standard, creating a single set of ratings based on the ratings from the experts.
To compare the evaluations of teachers with students, you can calculate the kappa value for experts vs teachers, and then calculate a second kappa value for experts vs. students. The higher kappa indicates more agreement with the experts.
You could probably use a t test instead to see which group scores better or even use Bland-Altman.
These are some ideas for how to proceed. I am sure there are others.
Charles
Hi there, I am reading this post and the instructions and wondering- how do you get a kappa value for each different variable?
Hello Dana,
The formula for doing this in Excel is shown in Figure 2.
Charles
Hi Charles, first of all – thank you for this extremely helpful site and the clear explanations!
I am integrating the Fleiss Kappa into my software, which is a labelling software for AI traing. So, once that is done, I get an idea about the reliability of my datasets.
Since I need to label hundred thousand of images I have a pool of freelancers that are categorizing images, generally about 8-10 build a group for one trait, and each image gets a max. of 4 votes. I have 7 categories from extreme strong to extreme weak.
I realised that the quality of the ratings is extremely dependent on the individual. And, moreover, there is a learning effect with the time: the observers become better.
So, this is similar to Maikes question from 2016, but a group comparison (like beginners vs. experienced) is too vague.
What would be the best concept do achieve such a score?
Best, Peter
Hi Peter,
Since the ratings are on an ordered scale (extreme strong to extreme weak), you shouldn’t use Fleiss’ kappa since it only deals with categorical ratings and would ignore the ordering. In this case, Gwet’s AC2, Krippendorff’s Alpha or ICC would be better choices since they handle ordered categories.
In your question, “What would be the best concept to achieve such a score?”, I don’t know what score you are referring to. What exactly are you trying to measure? The difference in ratings between the experienced vs beginners?
Charles
Hi Charles, okay, thanks, i´ll try to use the other choices.
And yes, my question was missing, sorry 😉
I want to measure the performance of a single rater (unexperienced freelancer) over time in comparison to a group of trainers (educated trainer) in order to see his learning success.
In some datasets i have two experienced trainers and two freelancers in others i have only one trainer and three freelancers.
Oh, and, of course, i have timestamps in my collected records, so i can build time-based datasets, like monthly or quarterly.
Hi Peter,
If you believe that the experienced trainers give more accurate ratings than the inexperienced ones, you can always conduct a t test (or something similar) to see whether there is a significant difference between the average ratings between the groups. Bland-Altman may be another option.
Charles
hello
I am working on a translation of a clinician rating scale
there is only one item with 7 point likert scale
for each patient there are two raters, these raters are not fixed thought the number of raters are fixed . after discussing illness history of a patient each rater is asked to rate the patient’s condition on these 7 points.
there are 40 patients in total with 2 raters for each patient
which type of analysis would be suitable I am using SPSS 20 and 25
Hello Muhammad,
If I understand correctly there are 40 patients, each rated by two raters (although the actual raters may vary) using a 7 point Likert scale.
Fleiss’ kappa would be a good choice since the raters may vary, but Fleiss’ only deals with categorical ratings and so with a Likert scale this is not a good choice.
I would therefore suggest using Krippendorff’s alpha or Gwet’s AC2. These are supported by Real Statistics. SPSS probably supports one or both of them, but I am not sure about this. Some version of ICC might also be appropriate.
Charles
Hi Charles,
I would like to ask you two things:
– I have a questionnaire y / n (21 questions) with 3 examiners, 20 cases, I have calculated the k for each single question. Is it wrong to use Davies-Fleiss’s theory of the average value of pe? from my analysis it seems the only way to represent the variability of the answers with dichotomous variables.
if k = 1, the upper value can be greater than 1?
Thanks in advance.
Hi Livia,
I am not familiar with the Davies-Fleiss measurement, and so I am not able to answer your question. I will add this to my list of possible future enhancements.
Charles
Dear Charles,
thanks for the answer to the first question.
Do you know how I can solve the problem of the confidence interval that exceeds the value 1 when k = 1?
Dear Livia,
The confidence interval should not exceed 1. If so, then I would suggest that you change the value to 1. I would first make sure there was no mistake made. If you send me an Excel file with your data and results, I will check this for you.
Charles
Hello,
Thanks so much for the information. My question is: is it possible/ does it make sense to calculate fleiss’s kappa for one subject. So for example 18 raters, with yes/no answers, for one question. The lead of the project I am working on would like to have the kappa value for each question to determine which question has the highest inter-rater agreement. When I attempt to implement this in r for one question at a time, I get strange results. (any questions with 100% agreement get an NaN kappa value and all the others have the exact same negative value). Thank you!
Patricia,
No, you can’t just have one question. If you have more than 3 questions, then you can calculate Fleiss’ kappa leaving out one of the questions. Yoy can do this for each question. This would give you some idea of the contribution of each question.
Charles
Thanks so much for you very helpful and user friendly page here! I have a question which I know might be stupid, but I am a doctor of literature and not maths… What does the 2 implicate in the formula of the standard error for κj in Definition 1: Fleiss’ Kappa?
Thanks for your time!!
Nandi,
I don-t know why there is a 2 in that formula. Not a stupid question, though.
Charles
Dear Charles Zaiontz,
Thank you for this amazing website and detailed explanations.
I am trying to examine inter-rater reliability for my survey but I got a little bit confused.
I have 280 different food pics (stimuli) and 50 (raters) different people rated these pics if they are low, average or high calorie (3 levels). So, 280 pictures were rated 50 times from different participants into 3 different calorie groups. I want to understand if I can statistically say that one food stimuli was considered as low calorie with consensus among raters by using Kappa. Can I use Fleiss’ Kappa or should I use something else?
Thank you so much in advance
Emre,
Fleiss’s Kappa will determine whether or not there is a high level of agreement between the 50 raters based on the 2800 pictures using all three categories (not just low calories). Fleiss’s Kappa won’t take into account the order of the three ratings. To take this order into account, you should use Gwet’s AC2.
Charles
Dear All,
What kind of kappa can i use to make the table like this by SPSS?
Table 1. Comparison of Allplex Respiratory Panel 1/2/3 and Anyplex II RV16 in the detection of a single respiratory virus
Kappa value Agreement
Observed kappa (95% CI) Positive Negative
% (95% CI) No.* % (95% CI) No.
1 AdV 0.78 (0.64-0.92) 70.8 (50.8-85.1) 24/19 99.5 (98.1-99.9) 376/381
2 229E 0.97 (0.90-1.00) 93.8 (71.7-98.9) 16/15 100 (99.0-100) 384/385
3 NL63 0.89 (0.78-1.00) 85 (0.64-0.94) 20/18 99.7 (98.5-100) 380/382
4 OC43 0.93 (0.82-1.00) 100 (77.2-100) 13/15 99.5 (98.1-99.9) 387/385
5 FluA 0.94 (0.87-1.00) 90 (69.9-97.2) 20/18 100 (99.0-100) 380/382
6 FluB 1.00 (1.00-1.00) 100 (72.2-100) 10/10 100 (99.0-100) 390/390
7 HBoV 0.83 (0.73-0.93) 90.3 (75.1-96.7) 31/35 98.1 (96.1-99.1) 369/365
8 HEV 0.70 (0.45-0.95) 54.5 (28.0-78.7) 11/6 100 (99.0-100) 389/394
9 MPV 0.88 (0.77-1.00 100 (80.6-100) 16/20 99 (97.4-99.9) 384/380
10 HRV 0.86 (0.78-0.93) 94.3 (84.6-98.1) 53/61 96.8 (94.4-98.2) 347/339
11 PIV1 1.00 (1.00-1.00) 100 (51.0-100) 4/4 100 (99.0-100) 396/396
12 PIV2 1.00 (1.00-1.00) 100 (72.2-100) 10/10 100 (99.0-100) 390/390
13 PIV3 0.57 (0.43-0.71) 95.5 (78.2-99.2) 22/48 92.9 (89.8-95.0) 378/352
14 PIV4 0.67 (0.05-1.00) 100 (20.7-100) 1/2 99.7 (98.6-100) 399/398
15 RSVA 1.00 (1.00-1.00) 100 (67.6-100) 20/20 100 (99.0-100) 380/380
16 RSVB 1.00 (1.00-1.00) 100 (83.9-100) 8/8 100 (99.0-100) 392/392
Total 0.78 (0.72-0.85) 93.2 (89.4-95.7) 84.7 (78.0-89.6)
“*No.: Number of results for each virus in AnyplexII RV 16/Allplex Respiratory Panel 1/2/3.
Abbreviations: AdV, adenovirus; 229E, coronavirus 229E; NL63, coronavirus NL63; OC43, coronavirus OC43; FluA, influenza A virus; FluB, influenza B virus; HBoV, human bocavirus 1/2/3/4; HEV, human enterovirus; MPV, human metapneumovirus; HRV, human rhinovirus A/B/C; PIV1, parainfluenza virus 1; PIV2, parainfluenza virus 2; PIV3, parainfluenza virus 3; PIV4, parainfluenza virus 4; RSVA, respiratory syncytial virus A; RSVB, respiratory syncytial virus B.”
Jean,
Generally with two raters and categorical data you can use Cohen’s kappa to test for agreement between the two raters. This data doesn’t appear to be categorical, but numerical. ICC might be a reasonable choice, but I don’t understand what kind of data you have, and so I can’t really say for sure.
Charles
How to use fleiss kappa in spss
Hello,
This website is about statistical analysis in Excel. I don’t use SPSS and so I don’t know the procedure in SPSS.
Charles
Hello Charles,
just wondering If I can use kappa with five point likert scale data? and can I use it with missing data?
thank you
Andre,
You can use Fleiss’s kappa with a 5 point Likert scale.
I don’t know of a way to use Fleiss’ kappa with missing data. You can use Gwet’s AC2 or Krippendorff’s alpha instead.
Charles
Hello Charles,
Thank you for the great statistic tools and information!
I have a question about Fleiss’ Kappa. I have about patient specimens read by three pathologists, and rating of each specimen is either positive for a high grade lesion or negative for high grade lesion. In the past , I’ve used the “interrater reliability” tool and calculated the Fleiss’ Kappa for several group of patients with certain diagnosis (according to a Gold Standard diagnostic method), and had no problem. However, For one group of patients (about 100 of them), all the doctors agreed that they have high grade lesion, so I was expecting to see a perfect agreement, and Fleiss’ kappa of 1, but when I tried to use the “interrupter reliability” tool, no Kappa was calculated (says there is a error in the formula). Just to play with it a little bit, I changed a few readings to “negative” and see what happens, the test did calculate a kappa this time, but it was a negative value. I’m not a statistic person, and now is very confused. Any suggestions? Thank you very much for your help in advance!
My data was listed like this:
Case# positive negative
1 3 0
2 3 0
3 3 0
until case #100
Susan,
Unfortunately, this sort of strange behavior does occur when using Fleiss’s Kappa. I suggest that you use Gwet’s AC2 instead if you want to avoid these sorts of counter-intuitive results.
Charles
Charles,
Thank you so much for your quick reply!
I tried Gwet’s AC2, and it worked really well. I do have another question: is there a way to compare agreement coefficients of two groups (say one AC2=0.8, and the other AC2=0.4) for statistic significance? I feel I’m in way over my head, but thought I’d ask just in case there is a function in there that I could use easily. Thank you so much for your help!
Susan
Susan,
You can calculate the confidence interval for each group and see whether these confidence intervals overlap. I think this approach might be useful to addressing the issue that you have presented.
Charles
Hello,
Thank-you for the great information! I would like to perform a Fleiss Kappa test to evaluate 3-4 inspectors rating coins for defects. I have a total of 23 categories of defects (including a category of “no defect”). Any tips or advice before I start? Thanks!
Theresa,
Since you have a great many rating categories, I hope that each inspector rates a lot of coins. Also, there are other approaches, Gwet’s AC2 and Krippendorff’s alpha, that can be used.
Charles
Hi Charles,
How do i get the reliability procedures menu? nothing is happening when i press ctrl-m.
Thanks
Aya,
What do you see when you enter the formula =VER() in any cell?
Charles
I am having this same issue. I get #NAME? when I enter =VER() and nothing happens when I click CTL-m
Lara,
This usually means that you have not installed the software. See installation instructions on the same webpage from where you downloaded the software. When the software is correctly installed you should see RealStats and Solver on the list of addins when you press the key sequence Alt-TI.
Charles
Hi. Thank you for this information. I have a question.
Can I use Fleiss’ Kappa with 12 different items and “yes” or “not” as the possible answers? I have 5 raters. They all will rate the same items.
Thanks
Eliaana,
Yes, you can use Fleiss’ kappa.
Charles
Hi Charles,
Thank you for this webpage. Can I use this method for only two raters in a similar scenario to your example? Will this give me similar results to Cohen’s kappa? More specifically, I want to calculate overall kappa and I’m not sure this is possible with Cohen’s kappa.
Thanks!
Farah,
I suggest that you try it and see what happens.
Charles
Hello.
I realize this may be a little late in the game, but I have a survey that I designed to obtain consensus on various aspects of a topic. This survey has three categories (agree, disagree, modify) and roughly 100 statements (cases). I have 41 raters who have take the survey.
Would Fleiss’ kappa calculation be appropriate for this? I need to establish if there is agreement between my raters regarding the various statement.
Thank you.
Aina
Aina,
Yes, you could use Fleiss- kappa.
Charles
The interpretation of Fleiss’ Kappa comes from this book:
Landis JR, Koch GG. The measurement of observer agreement for categorical data. Biometrics 1977;33(1):159-74.
<0 Poor agreement
0.0-0.20 Slight agreement
0.21-0.40 Fair agreement
0.41-0.60 Moderate agreement
0.61-0.80 Substantial agreement
0.81-1.0 Almost perfect agreement
Hi there, thank you for this helpful page!
I am wondering, what is the reason why you cannot simply calculate Cohen’s kappa for each pair or raters and find the mean of those values to give an overall represetation of agreement?
For example, I am looking at this paper currently:
https://www.ncbi.nlm.nih.gov/m/pubmed/19649750/
Choen’s Kappa values reflecting inter-observer reliability among 4 readers ranged from 0.39 to 0.79, and were averaged to give a mean 0.60, taken as a overall index of reliability.
Should Fleiss’ Kappa have been used ideally?
Emily,
You can take such an average, but then the question is how to interpret this measurement.
Charles
Hi Charles,
I could be wrong but it appears your formula for SE in figure 2 (cell H9) is missing an array term in the sumproduct function. In the equation in the text, you write the second term in the numerator of the square root as:
q_j*(1-q_j)*(1-2*q_j)
yes the sumproduct in figure 2 is written as:
sumproduct(B18:E18,1-2*B17:E17)
where row 17 is q_j and row 18 is 1-q_j
without this extra term, the radicand can become negative and the SE incalculable.
Hoping I’m right on this.
nevermind. I see that row 18 is q_j*(1-q_j).
Still getting a negative radicand. Is that possible?
Hi Charles I am trying to use Fleiss K but I have an issue using formula for cell H9.
I wrote : B24*RACINE(SOMME(B22:D22)^2-SOMMEPROD(B22:D22,1-2*B21:D21))/SOMME(B22:D22) but it’s not working excel says it’s a problem with “D22,1-2” do you have an idea about how to fix it?
Thank you very much for your help !
Camille,
The correct formula in English is
=B20*SQRT(SUM(B18:E18)^2-SUMPRODUCT(B18:E18,1-2*B17:E17))/SUM(B18:E18)
I believe that in the French version, you need to replace the comma by a semicolon. Thus, “D22,1-2” should be “D22;1-2”.
Charles
Thank you for your help Charles !
Thank you, Charles. Will it be possible for me to send you my data and for you to have a look at it on how best to represent my data?
Joan,
Yes, you can send me your data.
Charles
Hi Charles,
I have completed a survey where the intention is to measure level of agreement on the diagnosis of 4 cases by 57 raters.
In each case, there are 4-5 possible answers given, but the aim is only to score them as 1 is rater 1 and rater 2 agree on the same diagnosis.
I understand Cohen’s kappa would only work for 2 raters. Would Fleiss’ kappa work in this instance, and how might I compute this (Is there a calculator I can use online)?
Thanks a lot.
Joan,
What criterion would you use if say you had 4 raters? 1 if all 4 agree and 0 otherwise?
Charles
Hi Charles,
I tried using Cohen’s kappa for a few cases manually at first and averaged out the kappa for each case. For 4 cases, it would as such:
Raters
1 vs 2
1 vs 3
1 vs 4
2 vs 3
2 vs 4
3 vs 4
That would work out to be 7 pairs.
If the diagnosis was the same, I scored it as 1; if it was discordant I scored it as 0.
For each case, I would then score the count as a fraction. Eg. If there was perfect agreement for 5 pairs, the count would be 5/7.
I would then add the fractions from each of the 4 cases and divide by 4.
However, I realized this wasn’t going to be possible for 56 raters!
Also, the values I worked out seemed to grossly underestimate the level of agreement.
From your explanation, Fleiss kappa seems to make more sense to me for my data. But it doesn’t seem to require a rater 1 vs 2 agreement, hence I am not quite sure how best to approach this and would greatly appreciate any advice.
Joan
Joan,
The typical approach is to use as input data the ratings made by each rater on each subject (independently of the other raters). The interrater measurement then calculates the degree of agreement between the raters. This makes things less complicated than the approach you are envisioning. You can use Fleiss’ kappa with 4 raters (or in fact any number of raters > 1) provided the ratings are categorical, i.e. not Likert scores (e.g. ratings from 1 to 5) or numeric values (ratings of 2.67 or 3.63, etc.). If you need non-categorical ratings, then there are other measurements available — e.g. Interacorrelation (ICC), Gwet’s AC2, Krippendorff’s alpha or Kendall’s W. All of these are described on the Real Statistics website.
Charles
I am conducting a content analysis pilot study on 23 novels. There are five coders and 16 personality traits. The traits are not mutually exclusive and the coders are marking them as either yes the trait was exhibited by the character or no it was not.
What is the best way to test inter coder reliability?
Lona,
I don’t have a definitive answer for you, just some ideas.
Fleiss’ Kappa handles the case where each rater assigns a rating for one of the traits. For your problem you have multiple traits and so possible approaches are: (1) simply report one Fleiss’ kappa measurement for each of the 16 traits, (2) combine the Fleiss’ kappa measurements in some way (average, max, etc.), (3) use some complicated coding that handles all 16 traits (e.g. a vector of 16 elements consisting of zeros and ones).
Approach 1 is simply and may be the best, but it doesn’t give ratings that handle all the traits simultaneously. Approach 2 seems pretty arbitrary, but is probably the one most often used. Approach 3 seems reasonable, but then you need to come up with some way of ordering the vectors or determining distance between vectors that captures similarity of ratings; in this case you wouldn’t use Fleiss’ kappa (which is restricted to categorical data) but Gwet’s AC2 or Krippendorff’s alpha or something similar.
I don’t know whether this issue is covered in the following book, but it covers interrater releiability:
Handbook of Inter-Rater Reliability, 4th Edition by Gwet
Charles
Hi Sir,
Thank you for the website. I’ve downloaded the resource pack, and tried to do the Fleiss Kappa analysis following the instruction, but got the error message saying “compile error in hidden module:correlation”. Could please help me to solve this problem? Thanks a bunch!
Susan,
Here are some steps for diagnosing or potentially resolving this problem.
1. Try using one of the Real Statistics functions. In particular, enter the formula =VER() and see whether you get an error, in which case, the software has not been installed correctly
2. Solver has not been installed. When you choose the Add-Ins option from the Tools menu, do you see RealStats and Solver in the list of addins with a check mark next to them?
3. See Hint 2 at https://real-statistics.com/appendix/faqs/disappearing-addin
4. The problem might be with the Trust Center settings. Click on Options from the File ribbon and then choose the Trust Center option on the left side. Next click on Trust Center Settings …. Next click on the Macro Settings option on the left side and make sure that it is Disable all Macros with Notification. Also click on the Trusted Locations option on the left side and click on the Add New Location… button to add the folder that contains RealStats-2007 folder as a trusted location.
5. Try opening a blank Excel worksheet and press Alt-TI. Uncheck the RealStats addin and close Excel. Now open a blank Excel worksheet and press Alt-TI. This time check the RealStats addin and now try to use the Fleiss’ Kappa analysis tool.
Charles
Thank you so much for your quick reply! Sorry I wasn’t clear, I’m using a MacBook, and Excel 2011. Does that make any difference? I don’t see “real statistic functions”, only the” data analysis tool”, and I was trying to use the “interater reliability” function in the “correlation” tab.
Anyway, I will also try PC, and see if that will work. Thank you so much for your help!
Susan,
Try pressing Ctrl-m or Cmd-m.
Also make sure that you get a valid value from the formula =VER()
Charles
Hi Charles,
Thank you so much for your help. =VER() returned “5.0 Excel Mac”. I also got the Kappa function to work, which will return a single number. However, when I tried to input all the parameters to get an output like Figure 3, it only returned a word “kappa”. On the bottom of the window where you put in the parameters, I can see part of the result (Kappa, s.e., but then got truncated, so I could not get the Z, p etc). Could you think of a reason for this? I feel like I’m very close to getting it to work properly, just not quite yet. Thank you, I really appreciate your help!
Susan,
The KAPPA function is an array function and so you can’t simply press Enter to get all the output. See the following webpage for how to use an array function:
Array Formulas and Functions
Charles
Sorry, forgot to say:
The parameters I put in were like this:
rg=E2:G18 (range of my data)
col=3 (I have 3 categories)
lab=TRUE (I’m not sure about this, just followed theexample, which said if I want to see a result in Figure 3, lab=TRUE, am I right?)
alpha=0.05
tail=2
orig=TRUE (I’m not sure what this is either or what else I could potentially chose to put in).
I tried to define my output area as 1 cell, a 1×6 area, a 2×6 area. None of them worked, all I saw was a word “kappa” in the first cell.
Any suggestion would be great appreciated.
Hi Charles,
Just want to let you know, I downloaded a PC version to my old old PC, it’s working. Thank you very much for all your help.
Susan,
This is good to hear.
Charles
Great article, I tried Fleiss Cappa and it worked. An excellent and easy to use software as well.
Just a question- I am doing IRR for a Clinical Audit Tool with 9 assessors. Each of them will assess if the clinical records done by clinicians are good, average or bad- so three categories. Will I be using one tail or 2 tail in this case?
Glad that you found the article and software useful.
Fleiss Kappa always uses a two-tailed test.
Charles
Thanks Charles,
I did the analysis, and it worked well for 9 out of 10 items I was assessing. it did not work for one item though: I have the data below:
Good Average Poor Non Resposne
9 0 0 0
9 0 0 0
9 0 0 0
9 0 0 0
9 0 0 0
9 0 0 0
9 0 0 0
9 0 0 0
9 0 0 0
9 0 0 0
9 0 0 0
9 0 0 0
9 0 0 0
9 0 0 0
9 0 0 0
9 0 0 0
9 0 0 0
9 0 0 0
9 0 0 0
9 0 0 0
As all nine assessors rated good for all samples, it should be showing as +1?
But the result was as shown below:
Fleiss’s Kappa
alpha 0.05
tails 2
Total Good Average Poor Non Resposne
#VALUE! #VALUE! #VALUE! #VALUE! #VALUE! #VALUE!
#VALUE! #VALUE! #VALUE! #VALUE! #VALUE! #VALUE!
#VALUE! #VALUE! #VALUE! #VALUE! #VALUE! #VALUE!
#VALUE! #VALUE! #VALUE! #VALUE! #VALUE! #VALUE!
#VALUE! #VALUE! #VALUE! #VALUE! #VALUE! #VALUE!
#VALUE! #VALUE! #VALUE! #VALUE! #VALUE! #VALUE!
Could you please help?
Thanks
This is an oddity of many of these measurements. Since the variance for your data is zero, the calculation of the statistic probably involves division by zero and so the statistic is undefined. In any case, you can assume that you have complete agreement and don’t really need to calculate kappa. You can treat it as if the value was +1.
Charles
Thanks Charles.
Hello Charles,
so I have a question. I have an open card sorting with 10 raters, 23 items and 2 categories.
It’s 230 ratings in total, and in 225 out of the 230 cases, the raters assigned the same category.
Using the add-in i get a Fleiss Kappa of 0,92067698.
However, the p-value always amounts to 0. How is that possible?
I also tried changing the numbers so there would be more volatility (e.g. set 225 down to 180 and the Fleiss kappa shrunk but the p-value is still 0?
Maybe it’s a problem since I am using a German Excel version?
The regular Cohen’s Kappa calculation also doesnt work for me
Tyvm!
Patrick,
If you send me an Excel file with your data and calculations I will try to figure what is happening.
The German version shouldn’t give a different answer from the US version (unless there is a problem with the decimal symbol).
You can find my email address at Contact Us.
Charles
Hi Charles,
Thank you so much for this website.
I have analyzed the inter- rater reliability for 5 raters on 34 items. the variables were dichotomous (correct, wrong). the Average pairwise percent agreement was 82.4%. However, the Fliess kappa was 0.32 and Krippendorff’s Alpha was 0.32 as well. Actually, I am frustrated, and I do not know how to report my data. or if there is away to correct the kappa.
your help is much appreciated.
Enas
Enas,
It looks like it is easy to report your results, although it seems like you don’t like the result.
The reason for doing analysis is to find out whether or not your hypotheses are correct. A negative result is still a result.
Charles
Hi Charles,
This has been very useful so far. Thank you.
My work is similar to your example but there are the following differences:
-instead of 4 psychiatric diagnoses, there are 2 columns: Absence and Presence.
-instead of 12 patients, there are 6 patients.
-instead of 6 raters, there are 15 raters.
I have two queries:
1. In one part of my research, all 15 raters agree on ‘Presence’ for every patient. However, Fleiss’ kappa can not be calculated because (if you follow your manual method) you end up dividing by 0. This is not possible. What should I do?
2. In another part, 15 raters agree on ‘Presence’ for the first 5 patients. For the final patient, 14 agree on ‘Presence’ with the remaining rater stating ‘Absence’. I would expect the kappa value to be relatively high. However, it is negative.
This is very confusing and I would be very grateful if you could help.
Thank you.
Joseph,
One of the problems with Fleiss’ Kappa is that you can get some counter-intuitive, esp. in extreme cases. My understanding is that Gwet’s AC2 measurement addresses some of these problems. The next release of the Real Statistics software will include support for Gwet’s AC2. Regarding your specific questions:
1. If all raters agree, simply report 100% agreement (don’t bother with Fleiss’ Kappa)
2. Once again with this level of agreement, you should simply report that you have 100% agreement except in one case.
Charles
Thank you.
Joseph
Hi Sir,
I would like to ask how can I assess the agreement between an isolated rater (master rater) VS a group of say 10 raters. The variables are ordinal, like No Disease, Mild Disease, Moderate Disease, Severe Disease.
Thanks in advance for your reply!
Angela,
The fact that the ratings are ordinal and that you want a comparison with a master rater makes Fleiss’ kappa a poor choice. Perhaps one of the following references will help you find the right choice:
https://en.wikipedia.org/wiki/Krippendorff's_alpha
http://john-uebersax.com/stat/agree.htm
https://orbi.ulg.ac.be/bitstream/2268/39575/1/vanbelle-thesis-5-5-2009.pdf
Charles
Thank you very much for your reply! I was reading the last link you gave and I am torn between which index of agreement to use. Do you have any idea which index (i.e. Vanbelle and Albert novel agreement index, consensus index or Schouten index) is more widely used and more suitable for my case? Also, should I use weighted or unweighted?
Thanks again! 🙂
Angela,
I don-t don-t have an opinion regarding which one is more widely used or which is better for you.
Since your data is ordered, you would normally choose weighted kappa over unweighted Cohen’s kappa.
Charles
Hi Sir,
Could you assist me with the following?
My response outputs from my 4 raters are non-categorical, for e.g ” 52 years, 53 years” . Initially, I manual group them into “Yes” and “No” before using SPSS to calculate the Kappa Scores. But, how do I go about in calculating the Kappa score for them without manual grouping the responses (Just by putting the raw data into SPSS)
Thank you!
Sorry Xinru, but I don’t completely understand your question. If you have non-categorical data, then Fleiss’ kappa is probably not the right tool to use. Perhaps ICC would be better.
Charles
Hi Charles,
Many thanks for producing this, it’s very helpful. I wonder if you could help me with a question. I’m trying to calculate the degree of interrater reliability between three raters when screening research papers for inclusion in a systematic review. The three raters have the option to include or exclude each of the 20 papers. I think I’ve followed you instructions for formatting correctly. The raters all agreed on 18 papers. On the other two there was a 2 to 1 split (ie. two raters said include, the other exclude).
When I input that, I get the following result:
Kappa = 0.86 (p <0.05), 95% CI (0.599, 1.118)
I noticed that the upper CI value is greater than 1. I assumed that the value would be bounded at 1 because that would represent perfect agreement. Have I misunderstood something or made an error?
Many thanks
Rob
Rob,
Yes, the upper bound becomes 1.
Charles
Hi Charles
Thanks for this – so would you recommend just reporting the CI as (0.599, 1)?
Rob,
Yes.
Charles
Brilliant, thanks for your help.
Hello, thank you very much for sharing them.
Could you do me a favor?
1. As you know, Cohen’s kappa has set of criteria, it is: less than 0% no agreement, 0-20% poor, 20-40% fair, 40-60% moderate, 60-80% good, 80% or higher very good. How about Fleiss’s kappa, are they the same?
2. What is the difference between Cohen’s kappa and Weighted Cohen’s kappa?
3. I need to measure the agreement between 8 raters. Is it possible if I use Cohen’s kappa for each couple of rates and then I measure the medium of all the kappa?
4. Is there any software of application to measure Fleiss’s kappa ( Ex: Something like spss or medcalc..)
Thank you so much for helping me!
Linh,
1. You can use the same criteria as for Cohen’s kappa, although there isn’t universal agreement about these criteria.
2. See Weighted Kappa
3. You can do this, but it is not clear how you would interpret the result
4. The Real Statistics software calculates Fleiss kappa. I would think that SPSS and Medcalc do as well, but I cant say for sure since I dont use these tools.
Charles
Thanks a million!!!
You’ ve been a big help.
Hi
I have a problem taking results from the reliability testing. I have 3 columns with marks (1,2,3) from 3 raters and when i run the Fleiss’s kappa on these values
rater1 rater2 rater3
1 1 2
3 3 3
1 1 1
2 2 2
3 3 3
3 3 3
2 2 1
1 1 2
I get this table
Fleiss’s Kappa
alpha 0,05
tails 2
Total rater1 rater2 rater3
#N/A #N/A #N/A #N/A #N/A
#N/A #N/A #N/A #N/A #N/A
#N/A #N/A #N/A #N/A #N/A
#N/A #N/A #N/A #N/A #N/A
#N/A #N/A #N/A #N/A #N/A
#N/A #N/A #N/A #N/A #N/A
please help if possible!
This is not the correct format. Each role is a different rater and each column is a different category. The sum of the values in each row must be the same across all the rows.
Charles
thank you very much for your reply!
I am sorry got it wrong! I had to sum the same marks and make a new table like that. (Please correct me if i am wrong!)
mark1 mark2 mark3
2 1
3
3
3
3
3
2 1
2 1
Thank you for the tools anyway!
Kostas,
This looks good, although when I see it on my computer all the columns are shifted left — in particular, there are no values for Mark3. You would have had to insert zeros for blank values, but this should not be a problem on the Excel spreadsheet.
Charles
yes the empty cells are ignored when i paste. anyway it works fine on excel. thanks again!
Data I sent earlier may be confusing. Please calculate Fleiss kappa and provide worksheet for following data-
A 70 3 2 4
B 2 44 5 0
C 3 6 29 1
D 5 1 1 24
Sorry, but I don’t know what data means. What does each row and each column mean?
Charles
i do not know to calculate Fleiss Kappa for following data. Please help
A 70 3 2 4
B 2 44 5 0
C 3 6 29 1
D 5 1 1 24
Hello Charles,
Unbelievably helpful…thank you! However, I am getting very low kappa’s for several surveys that we are making and I have read about this paradox when there is very high agreement (skewed distribution). Can you take a peek at our spreadsheet to ensure it is correct. It reflects 10 dichotomous ratings by 10 people about the understanding of survey items (first column). They are in very high agreement. Is there a way to handle this and way to report the kappa (or ranges) that is meaningful? Blue rows were not included in the analyses. I truly appreciate any insight that you can provide.
Renee,
If you send me an Excel file with your data and calculations I will look at it.
See Contact us for my email address.
Charles
Hi, Charles
Thanks for great article. I think, it is so benefit for analyse Multiple rater kappa (Fleiss’ Kappa). I have some problem such as negative kappa and not’s sure that I calculate data correct. Would you mind, if I want you to recheck my data calculation.
https://drive.google.com/open?id=0B9MaApJTSiHwTTYzM0JnNXdvMXc
Regards,
Pick
Pick,
No this isn’t the correct calculation. The main problem is that your columns correspond to the raters instead of the rating categories. Also the sum of the values in each row should be the same.
Charles
Hi Charles.
My research consists of 6 categories (Strongly Agree, Agree, Slightly Agree, Slightly Disagree, Disagree and Strongly Disagree) , 27 items, and 9 raters. Below are the results based on this article:
m=9
n=27
Pa=0.322016461
Pe= 25.28172394
kappa=1.027921557
se=0.018256452
z = 56.30456314
p-value = 0
The kappa value is 1 which means excellent agreement but the z-value is so high. Is there something wrong based on the results? Thank you very much.
Rose
Rose,
Without seeing the raw data, it is hard for me to comment. More importantly though, Fleiss’ kappa is designed for categorical ratings. You are using ordered ratings and so the order will not be taken into account in Fleiss’ kappa. You might be able to use the intraclass correlation (ICC) instead or some form of weighted Fleiss’ kappa. Here are two articles about this latter approach:
https://www.researchgate.net/publication/24033178_Weighted_kappa_for_multiple_raters
http://www.sciencedirect.com/science/article/pii/S1572312711001171
Charles
Dear Charles,
Thanks for sharing this! Im having trouble with dichotomous variables and 4 raters. Is there any option to calculate an ICC or Fleiss’ Kappa with dichotomous variables?
Tim,
You should be able to use Fleiss’s kappa with a dichotomous variable. What sort of problem are you having?
Charles
Im having a lot of zeroos in my data. For example a column could contain 300 zeroos and only one 1.
So there is no use in calculating mean and se?
Thanks!
I can’t say for sure without seeing the data, but with such data it may not be useful to compute Fleiss’ Kappa Or any other similar measurement.
Charles
Is there a possibility that I send you an example of the dataset?
Thanks in advance.
Yes, please send me the data.
Charles
Thank you for this information on Fleiss Kappa.
I am still having difficulties in conducting the Fleiss Kappa. I have 2 raters that evaluated over 1000 events for 3 different evaluation categories. The raters can only use 1 category out of the 3 to rate an event. I cannot do a Cohen Kappa because more than 3 evaluation category so I was doing an agreement score between the 2 raters but I have been told to do instead a Fleiss Kappa. I have organized my Excel table where for each event the evaluation category is 0 if no agreement and 1 if the 2 juges agree. So for each event you will have either three scores as 1 (if agreement) or two scores as 0 and one score as 1 (if disagreement). I wanted to do a Fleiss Kappa in SPSS or even Excel but I either way I cannot find how. Thank you in advance for your help with this.
Josee,
If you only have two judges, you can use Cohen’s kappa, even with 3 or even more categories.
Charles
Good morning Charles,
In an experiment that we’re doing, we found that we have in some cases perfect agreement between the 10 judges, but anyways, doing kappa fleiss it seems to be no valid or in negative values of kappa.
Can you help us to analyse this answers? Here i copy the link of the experiment.
https://drive.google.com/open?id=0B5lxuC4qxrbmSWo4YUhNdHhKZ3M
Paola,
If you are getting a negative value for kappa, this indicates that there is no agreement among the judges.
Charles
Hello Charles, Thanks for answering!
We checked your comment, but we don’t understand why the Kappa is negative or equals 0, when the whole group of Judges answer with the same evaluation category.
Here I send you the cases I just mentioned. Help me please 🙂
https://drive.google.com/open?id=0B5lxuC4qxrbmbDRSRDNOd2g2V1k
Thanks in Advance
Paola,
Your calculations seem correct.You are right that this is a strange result. With complete agreement the result is negative. Apparantly Fleiss’s kappa is prone to this sort of problem with unbalanced data. See the following webpage for more information:
http://stats.stackexchange.com/questions/47973/strange-values-of-cohens-kappa
Charles
Thank you very much Charles
hello,
I need your help please regarding the calculation of kappa for a study. I have 5 raters for 13 articles. the rate is mainly based on scores from 1 to 5. I want to check the reliability by calculating kappa for each rater and overall.
Simone,
Kappa is a measurement of the overall differences between raters. You don-t calculate a kappa value for an individual rater.
The way to calculate Fleiss’s kappa is shown on the referenced webpage.
Charles
Charles,
I am conducting a controlled test in which I have 30 evaluators and 10 pairs of samples. I am providing a sample pair to an evaluator to review and determine if the 2 cards are the same or different. Within the 10 pairs I have the 6 pairs that are different and 4 are the same. I know the standards and controls.
My null hypothesis is that the cards are the same.
My alternate hypothesis is that the cards are different.
How would you recommend analyzing the data? One set? Separated?
In Minitab using 1 set I am obtaining a p value of 1.0 in the Fleiss’ Kappa Statistics section and negative Kappa values.
Fleiss’ Kappa Statistics
Response Kappa SE Kappa Z P(vs > 0)
Different -0.310712 0.05 -6.21425 1.0000
Same -0.310712 0.05 -6.21425 1.0000
Thank you in advance!
Ben, regarding whether you create one Fleiss’ Kappa or two (one for the cards that are different and another for the cards that are the same), this really depends on what you are trying to show. Either can be useful.
I don’t understand why you need to set null/alternative hypotheses or why you have chosen these hypotheses.
Charles