Basic Concepts
Cohen’s kappa is a measure of the agreement between two raters who determine which category a finite number of subjects belong to, factoring out agreement due to chance. The two raters either agree in their rating (i.e. the category that a subject is assigned to) or they disagree; there are no degrees of disagreement (i.e. no weightings).
We illustrate the technique via the following example.
Example
Example 1: Two psychologists (judges) evaluate 50 patients as to whether they are psychotic, borderline, or neither. The results are summarized in Figure 1.

Figure 1 – Data for Example 1
We use Cohen’s kappa to measure the reliability of the diagnosis by measuring the agreement between the two judges, subtracting out agreement due to chance, as shown in Figure 2.

Figure 2 – Calculation of Cohen’s kappa
The diagnoses in agreement are located on the main diagonal of the table in Figure 1. Thus, the percentage of agreement is 34/50 = 68%. But this figure includes agreement due to chance. E.g. Psychoses represents 16/50 = 32% of Judge 1’s diagnoses and 15/50 = 30% of Judge 2’s diagnoses. Thus, 32% ∙ 30% = 9.6% of the agreement about this diagnosis is due to chance, i.e. 9.6% ∙ 50 = 4.8 of the cases.
Similarly, we see that 11.04 of the Borderline agreements and 2.42 of the Neither agreements are due to chance, which means that a total of 18.26 of the diagnoses are due to chance. Subtracting out the agreement due to chance, we get that there is agreement 49.6% of the time, where
![]()
Some key formulas in Figure 2 are shown in Figure 3.
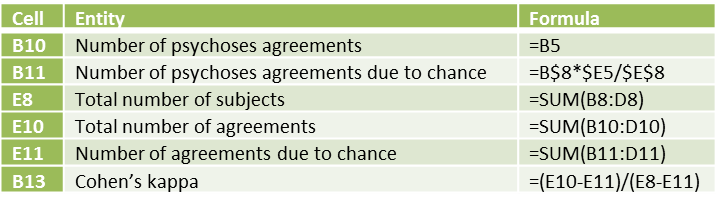 Figure 3 – Key formulas for worksheet in Figure 2
Definitions
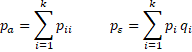
Definition 1: If pa = the proportion of observations in agreement and pε = the proportion in agreement due to chance, then Cohen’s kappa is
![]()
Alternatively,![]()
where n = number of subjects, na = number of agreements, and nε = number of agreements due to chance.
Another way to calculate Cohen’s kappa is illustrated in Figure 4, which recalculates kappa for Example 1.
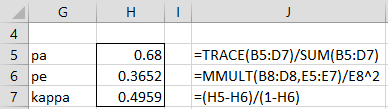
Figure 4 – Calculation of Cohen’s kappa
Properties
Property 1: 1 ≥ pa ≥ κ
Proof:
![]()
since 1 ≥ pa ≥ 0 and 1 ≥ pε ≥ 0. Thus, 1 ≥ pa ≥ κ.
Observations
Note that
![]()
Thus, κ can take any negative value, although we are generally interested only in values of kappa between 0 and 1. Cohen’s kappa of 1 indicates perfect agreement between the raters, and 0 indicates that any agreement is totally due to chance.
There isn’t clear-cut agreement on what constitutes good or poor levels of agreement based on Cohen’s kappa, although common, although not always so useful, criteria are: less than 0% no agreement, 0-20% poor, 20-40% fair, 40-60% moderate, 60-80% good, 80% or higher very good.
A key assumption is that the judges act independently, an assumption that isn’t easy to satisfy completely in the real world.
Standard Error
Provided npa and n(1–pa) are large enough (usually > 5), κ is normally distributed with an estimated standard error calculated as follows.
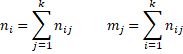
Let nij = the number of subjects for which rater A chooses category i and rater B chooses category j, and pij = nij/n. Let ni = the number of subjects for which rater A chooses category i, and mj = the number of subjects for which rater B chooses category j. Now define
![]()
Thus
We calculate the standard error using the formula
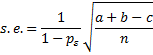
where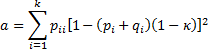
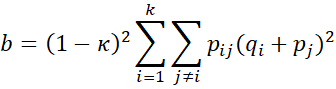
![]()
Standard Error Example
Example 2: Calculate the standard error for Cohen’s kappa of Example 1, and use this value to create a 95% confidence interval for kappa.
The calculation of the standard error is shown in Figure 5. Here, for example, the formula for cell S7 is shown in cell U7, and the formula for cell S11 is shown in cell U11.
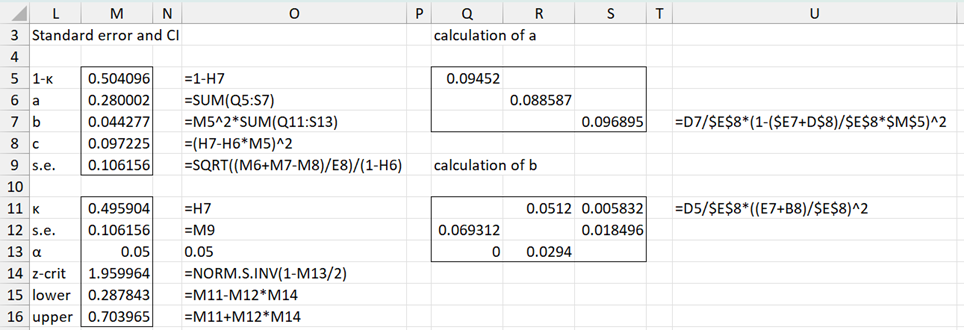
Figure 5 – Calculation of standard error and confidence interval
We see that the standard error of kappa is .10616 (cell M9), and so the 95% confidence interval for kappa is (.28784, .70397), as shown in cells O15 and O16.
When raters are not people
In Example 1, ratings were made by people. The raters could also be two different measurement instruments, as in the next example.
Example 3: A group of 50 college students is given a self-administered questionnaire and asked how often they have used recreational drugs in the past year: Often (more than 5 times), Seldom (1 to 4 times), and Never (0 times). On another occasion, the same group of students was asked the same question in an interview. The following table shows their responses. Determine how closely their answers agree.

Figure 6 – Data for Example 3
Since the figures are the same as in Example 1, once again kappa is .496.
Other Versions
Cohen’s kappa takes into account disagreement between the two raters, but not the degree of disagreement. This is especially relevant when the ratings are ordered (as they are in Example 2. A weighted version of Cohen’s kappa can be used to take the degree of disagreement into account. See Weighted Cohen’s Kappa for more details.
You can also use another modified version of Cohen’s kappa, called Fleiss’ kappa, where there are more than two raters. See Fleiss’ Kappa for more details.
Worksheet Function
Real Statistics Function: The Real Statistics Resource Pack contains the following function:
WKAPPA(R1) = where R1 contains the observed data (formatted as in range B5:D7 of Figure 2).
Thus, for Example 1, WKAPPA(B5:D7) = .496.
Actually, WKAPPA is an array function that also returns the standard error and confidence interval. This version of the function is described in Weighted Kappa. The full output from WKAPPA(B5:D7) is shown in range AB8:AB11 of Figure 7.
Data Analysis Tool
Real Statistics Data Analysis Tool: The Real Statistics Resource Pack provides the Interrater Reliability data analysis tool, which can be used to calculate Cohen’s Kappa as well as a number of other interrater reliability metrics.
To calculate Cohen’s Kappa for Example 1, press Ctrl-m and choose the Interrater Reliability option from the Corr tab of the Multipage interface as shown in Figure 2 of Real Statistics Support for Cronbach’s Alpha.
If using the original interface, then select the Reliability option from the main menu and then the Interrater Reliability option from the dialog box that appears, as shown in Figure 3 of Real Statistics Support for Cronbach’s Alpha.
In either case, click on the OK button (or double-click on the Interrater Reliability option) to bring up the dialog box shown in Figure 7.
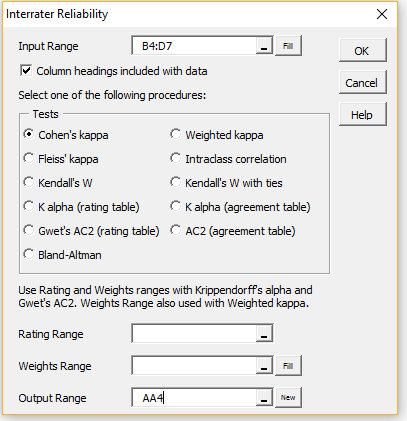
Figure 7 – Interrater Reliability dialog box
Fill in the dialog box as shown in the figure by inserting B4:D7 in the Input Range and choosing the Cohen’s kappa option. Upon clicking on the OK button, the output shown in Figure 8 is displayed.
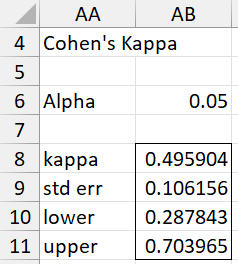
Figure 8 – Cohen’s Kappa data analysis
If you change the value of alpha in cell AB6, the values for the confidence interval (AB10:AB11) will change automatically.
Statistical Power and Sample Size
Click here for a description of how to determine the power and sample size for Cohen’s kappa in the case where there are two categories.
Examples Workbook
Click here to download the Excel workbook with the examples described on this webpage.
Links
References
Wikipedia (2012) Cohen’s kappa
https://en.wikipedia.org/wiki/Cohen%27s_kappa
Widmann, M. (2020) Cohen’s Kappa: what it is, when to use it, how to avoid pitfalls. KNIME
https://www.knime.com/blog/cohens-kappa-an-overview#:~:text=Cohen’s%20kappa%20is%20a%20metric,performance%20of%20a%20classification%20model.
Fleiss, J. L., Cohen, J, Everitt, B. S. (1969) Large sample standard errors of kappa and weighted kappa. Psychological Bulletin.
https://www.semanticscholar.org/paper/Large-sample-standard-errors-of-kappa-and-weighted-Fleiss-Cohen/f2c9636d43a08e20f5383dbf3b208bd35a9377b0
Hello Charles,
Thanks for this Site,
I like to compare 2 new tests with the gold standard test to determine the Wake/Sleep state in 30 sec epoch basis.
I have 100 subjects with almost 30000 epochs in total.
In pooled epoch basis and in per subject basis, I calculate the sensitivity, specificity and LR for each new test.
My Questions:
1-Which analysis base is the best: per subject or pooled epochs?
1-Could I use Cohen’s Kappa to compare the agreement of each new test with the gold standard?
2- Is this formula right? K=Po-Pe/1-Pe
Po=(TP+TN)/tot
Pe= Probability of random positive+Probability of random negative.
3-Should I calculate the mean and SD
Many thanks in advance
Bassam,
You can use Cohen’s kappa to determine the agreement between two raters A and B, where A is the gold standard. If you have another rater C, you can also use Cohen’s kappa to compare A with C.
I am not sure how to use Cohen’s kappa in your case with 100 subjects and 30000 epochs. If epochs are among the subjects, then perhaps your data consists of the measurements for the 30000 epochs. I am not sure since I don’t know what these epochs represent nor how they are related to the subjects.
Note that another approach for these sorts of scenarios is to use Bland-Altman, which is described on the website at
https://real-statistics.com/reliability/bland-altman-analysis/
Charles
Hi Charles, thanks for this very helpful resource. I have a question I would very much like your help with please.
Scenario:
I have 2 raters.
Each rater has been given a series of behavioural recordings to observe, and has been asked to score the presence (or absence) of three different categorical events within a series 30 second epochs. Each recording lasting several hours so there are a few hundred epochs. Lets call the event categories: 0 (no event); 1; 2; and 3
There are 8 recordings, each from a different test subject.
My aim is to understand the level of agreement between the two raters in terms of scoring the events, for the whole cohort.
My questions:
Q1- I understand that I could use Cohen’s kappa to determine agreement between the raters for each of the test subjects individually (i.e. generate a statistic for each of the 8 participants). Am I correct here? Is this the appropriate test?
Q2 – Is there a way for me to aggregate the data in order to generate an overall agreement between the 2 raters for the cohort of 8 subjects?
I hope this makes sense. Many thanks in advance for any advice you can offer
Alex,
Q1 – Yes, Cohen’s kappa is used for this purpose with categorical data
Q2 – It really depends on what you expect the aggregation of Cohen’s kappa to represent. You can use the average of the kappas to represent the average kappa. You can use the minimum of the kappas to represent the worst case agreement, etc.
Charles
Very helpful, thank you
Hello Sir,
I am a PhD student attending in Thailand.
I have one question to calculate kappa statistics.
I constructed 18 questions with 5 likert scales as (strongly disagree, disagree, neutral, agree and strongly agree). I gave scores according to questions as 1,2,3,4,5.
Women (n=762) and health care providers (n=164) answered these 18 questions.
Can I calculate kappa in these two different sample size groups?
How can I calculate it?
It is not clear to me what you are using Cohen’s kappa for. Do you want to see whether the ratings by the women agree with the ratings by the healthcare providers? Cohen’s kappa measures the agreement between two raters, each of whom rates each subject once. This is quite different from the scenario you have described.
Charles
Hi Charles
Please advise, the data collection instrument has 3 sections. Sec. A=demographic data/Sec B=wound related data and Sec C= 8 open and closed ended questions to determine patient knowledge on wound care(4 of which are yes/no).An interrater reliability observation will be used to determine the validity and reliability of the tool.Please advise on how to use Kappa to get the results
Millicent,
Cohen’s kappa doesn’t measure validity. It measures a type of reliability, namely differences between two raters (not internal consistency — Cronbach’s alpha measures this). If you are looking to measure internal consistency, then you shouldn’t include section A, and perhaps not B (I am not really sure what sort of questions are in this section). Even if internal reliability is relevant for section B, you should have separate measurements for section B and C.
If you really are interested in inter-rater reliability (the type measured by Cohen’s kappa), then this sort of measurement could be applicable to section B, unlikely to be applicable to section A or C.
Charles
Hi Charles,
Thanks for this extremely helpful site! I am looking to the determine intercoder reliability
(IR) of a content analysis of newspapers.
We are looking for the presence of up to 14 ‘codes’ in each article.
I can calculate the IR for each code, but i need to know the overall IR for the entire
group of codes.
Do i simply take an average of all 14 of my Kappa scores?
Curtis
Curtis,
It really depends on why you want to have one overall measurement. The average might be useful, although I can’t think of any use for this. Perhaps the minimum would be better. In general, I would simply report the 14 individual kappas.
Charles
Thanks Charles!
The Kappa is being calculated to represent the reliability of the coding instrument (i.e., coding instructions/guide). The purpose is to provide an overall measurement of the guide itself. The literature that I have on the content analysis of newspapers typically provides an individual kappa that represents the study’s coding instrument.
Curtis,
An mean value may be useful, but a minimum value may also be useful. I don’t have a single answer for you.
Charles
I appreciate your advice Charles!
Hi Charles,
I have a question regarding Cohen’s Kappa for partial-interval recording. I have two observers coding the presence (+) or absence (-) of two different behaviors during 30 same-length intervals. I have calculated the inter-rater reliability for four sessions using interval-by-interval IOA and Cohen’s Kappa. For my IOA, it is acceptable (and expected) to report mean IOA across both behaviors and all participants. Can you do the same for Kappa values? In other words, could I calculate the Kappa value for each behavior during each observed session, and then report an average Kappa value across all participants/sessions? I am new to the use of Cohen’s Kappa, so I apologize if my explanation is not clear!
Sorry Devon, but I don’t understand your comment. Also, what is IOA?
Charles
Hello, thanks for your post. I have one question. Two teachers evaluated the student’s answer to a written question according to categories. These categories reveal an increased level of knowledge – but, all the answers have the same weight (score 1 point for each correct answer and 0 for each incorrect). I need to calculate the inter-rater reliability, but I don’t know if I use Cohen’s Kappa or Kendall’s W. Can you help me?
Cheers.
Joana,
Is there only one question and it is scored 0 for incorrect (irrespective of the category) and 1 for correct?
How many students are there?
Charles
Hi Charles,
Thanks for this amazing resource.
I tried to make it work for me, but I am naïve with excel. So when I enter that part “=TRACE B5:D7)/Sum(B5:D7)” I always get error. So what is exactly (TRACE)?.
I don not know if it makes difference but I am using excel 2017 on mac.
Many thanks.
The formula =TRACE B5:D7)/Sum(B5:D7) should be =TRACE(B5:D7)/Sum(B5:D7)
Charles
Thanks for the reply.
I apologize; I missed the “(” while typing my question here, but it was there in excel. I double confirmed. I even copied the one you provided. The resulting cell shows this error “#NAME?”.
I much appreciate your answer.
What do you see when you enter the following formula? =VER()
When you press Alt-TI do you see Solver and RealStats on the list of add-ins with a check mark next to them?
Charles
The solver add-in and analysis toolpak are checked (installed). Writing “=ver()” returns error “#NAME?”.
Thank you,
Yasser
Yasser,
You need to make sure that RealStats is also on the list of addins with a check mark next to it. RealStats is not the same as Analysis Toolpak. You probably need to click on the Browser button to find RealStats.
Charles
Hi, I can’t find the “TRACE” function in excel 2007. And is it the function try to calculate the some of the diagonal elements?
TRACE is a Real Statistics function and so you need to install the Real Statistics Resource Pack to use it.
Charles
This is a very useful website! Thanks for explanation about kappa statistic.
I have a question; can I compare the Cohen’s kappa coefficients of two different groups (for which the activity of rating agreement was the same).
Is it ok to use confidence intervals for each kappa point estimate and see if they overlap (if not, then the two estimates are significantly different from one another)?
Andrea,
This seems like a reasonable idea, but I am not sure about its validity. The following webpage indicates that someone else agrees with your approach:
https://stats.stackexchange.com/questions/181201/how-to-compare-two-cohens-kappa-statistics-based-on-the-same-sample-of-subjects
Charles
Dear Charles,
Thank you for your website! It’s very helpful!
I have a question: would be enough to report in an article just Cohen’s kappa without calculating Confidence limits? I really want to skip this step but may be it’s a must?
Thank you for your help!
Bests regards
Rano.
Rano,
This depends on the publisher and the audience that you are reporting to.
Charles
Hi Charles, I’m doing some personality research and would like to find out the level of agreement that my participants has with 15 quotes from someone famous. The kicker is, I need to modify these quotes so that the participants do not recognise who it came from (would bias them towards or against). So I have transformed these quotes, so now I have 15 statements that I believe have the essence of what the original quote stated, but I don’t want someone to attack my methodology by saying that my transformed quotes are not an accurate representation of the original quote. My question, can I use two raters to view the original quote and the transformed quote and then record whether they feel it is similar or not similar? The idea is Grounded on the idea that people do something similar when testing Measures/scales in different languages and needing to make sure that the translated item correctly grasps the essence of the originals.
Cheers!
Dylan,
This seems like a reasonable approach.
Charles
Hi Charles,
I am trying to figure out how to calculate kappa for the following:
I have 80 quotes coded by two raters. However, in total I have 6 codes, which are categorized in pairs (Level1-Yes, Level1-No; Level2-Yes, Level2-No; Level3-Yes, Level3-No). Some quotes are coded using multiple codes. What do you think would be the best way to calculate the kappa. I am a bit confused.
Thanks so much in advance!
Kaan,
If the 6 codes are really categorical, without any explicit or implicit order, then you can just use Cohen’s Kappa. You can code the 6 outcomes any way you like (they will be treated as alphanumeric).
If there is some order, then the answer depends on the ordering, but it is likely you can use some version of Weighted Kappa.
Charles
Hello,
I wan to measure inter rather agreement of 10 raters on 5 cases. They rated each case using two variables ( ordinal 6- point scale and categorical with 7 categories). Can I use pairwise Kappa for that and can I compared the different in the k values of the two variables using paired sample t-test?
Ahmad,
You can do both things, but I am not sure the results will help you that much.
1. Cohen’s kappa: You would create two kappa values, one for each variable.
2. T test: this does seem like comparing apples with oranges
Charles
If you have a 3 x 3 matrix like in this example. What would be the formula to calculate the proportion of specific agreement? If I am interested in calculating the proportion of psychotic patients by both judges (percent agreement)? For general 2 x 2 matrix that would be proportion of positive agreement (2a)/(N+a-d) but what is the formula (i.e. numerator and denominator in this example) in 3 x 3?
Maarit,
Cohen’s kappa is only used in the 2 x 2 configuration.
Charles
Hello!
Thank you very much for the help!
I have one question: Is this applicable also to inter coder reliability? Is it easily applied in order to test the reliability between two coders?
Thank you in advance.
Eva,
Yes, Cohen’s kappa is used for intercoder reliability to measure the agreement between two coders.
Charles
This information is very helpful. Any advice on how to cite your work?
Maxwell,
See Citation
Charles
Many people claim that kappa does not really reject by-chance agreement.
What is your view?
regards
I don’t have a strong view, except to say that this, as well as other measurements, can be useful but are limited.
Charles
I don’t have a strong view, except to say that this, as well as other measurements, can be useful but are limited.
Charles
Hello Charles,
Thank you for this great guide.
I am having problems with calculating kappa scores between 4 reviewers (let’s call them A, B, C, D). First separated into pairs and did 25% of the screening work, then we switched pairs again, to do another 25% of the work.
So:
A+B = 25% of work
A+C = 25% of work
B +D = 25% of work
C+D = 25% of work
I have no idea how to calculate this score – could you please advise me what is the best way to calculate the combined kappa score?
Stella,
I don’t know a way to calculate kappa in this case.
Charles
Dear Charles
I am really impressed by your website, and would really appreciate your help please.
I have data for classification of medical cases, and i want to calculate the Inter-class & Intra-class agreement for it.
Would you able to help me with that please?
Many thanks
See Intraclass Correlation
Charles
Hi Charles,
I have the following results for my data set:
N=132, Comparing 2 screening tests with 3 risk category groups no risk, low-moderate risk and high risk.
Observed agreement 47/132 35.61%
Expected agreement by chance 46 / 132 35.06%
Kappa SE 95% CI
Kappa value (adjusted for chance) 0.0085 0.051 -0.092 to 0.109
Kappa value with linear weighting 0.082 0.0492 0.033 to 0.179
Maximum agreement of weighted kappa 60.6%
As I proposed in my hypothesis these 2 screening test do not agree!
Is there any use calculating a P value for the K and wK? if not, why not?
Jo,
I can’t see any real advantage of calculating the p-value. It will only tell you whether kappa is significantly different from zero. This is true if zero doesn’t lie in the confidence interval and the confidence interval gives you more information.
Charles
Hello,
Thanks very much for making this package freely available – it is very useful!
I’d like to include the the results in a report template and I was wondering if there is any way of making the result of the kappa calculation done using Ctrl-M can be made to appear on the same worksheet instead of it appearing automatically on a new sheet? Or for it to appear on a pre-designated blank sheet?
Thanks in advance for your advice.
Please don’t bother replying! Saw the output range field!! *smacking forehead*
Good day!
Can I use this formula for interval data? thanks
Shiela,
Yes, you can use Cohen’s kappa with interval data, but it will ignore the interval aspect and treat the data as nominal. If you want to factor the interval aspect into the measurement, then you can use the weighted version of Cohen’s kappa, assigning weights to capture the interval aspect. This is described at Weighted Kappa.
Charles
I would like to estimate sample size for my study. Here is the necessary details for your review/action.
One enumerator will conduct two different interviews (one at hospital and one interview at client’s home) with a same client. Which means, one client will be interviewed twice at different locations by same enumerator. Therefore, I would like to assess inter-rated reliability testing between the responses. Whether there is a change in response if clients give an interview at hospital and again interviewed at home?
This is my hypothesis and I wanted to collect xx number of sample in order to test the responses. The study is on “Assessment of Quality of Care related to Family Planning provided by doctor”.
Can you please let me know the desire sample size or how to estimate sample size for IRR?
One approach is to provide an estimate of what you think the measurement of Cohen’s Kappa will be (e.g. based on previous studies or the value you need to achieve). You then calculate the the confidence interval (as discussed on the referenced webpage). This calculation will depend on a sample size value n. The narrower the confidence interval, the higher the value of n needs to be. So you first need to determine how narrow you want this confidence interval to be (i.e. how accurate you need Cohen’s Kappa to be) and once you have done this, progressively guess at values of n that will achieve this sized confidence interval. You can actually use Excel’s Goal Seek capability to avoid the guessing part. I explain all of this in more detail for Cronbach’s alpha; the approach is similar.
Charles
I ran Cohen’s Kappa on a dataset to examine IRR and I am now questioning my choice of statistic. What I have are 100 different raters of two different types (Rater1 and Rater2). Each pair of raters assessed 6-8 people on 25 behaviors using a 4 point rating scale. So, I do not have multiple raters examining the same people (R1 and R2 assessing all people) which seems to be an assumption for Kappa. I have 50 R1s and 50 R2s (paired). The pair independently rated the same 6-8 people on those 25 behaviors using the same 4-point rating scale. I easily calculated percent agreement, but I need a more robust analysis. I would appreciate your insight and suggestions.
Teddy,
If each person is only assessed by one rater, then clearly Cohen’s Kappa can’t be used. In fact, all the measurements that I am familiar with require that each subject be rater by more than one rater.
Cohen’s kappa can be used when all the subjects are rated by both raters. If you have more than two raters then Fleiss’s kappa or the Intraclass correlation coefficient could be used. You might even find Kendall’s W to be useful. I suggest that you investigate each of these on the Real Statistics website.
Charles
Teddy,
If each person is only assessed by one rater, then clearly Cohen’s Kappa can’t be used. In fact, all the measurements that I am familiar with require that each subject be rater by more than one rater.
Cohen’s kappa can be used when all the subjects are rated by both raters. If you have more than one rater then Fleiss’s kappa or the Intraclass correlation coefficient could be used. You might even find Kendall’s W to be useful. I suggest that you investigate each of these on the Real Statistics website.
Charles
Hi Charles,
This is a really nice website and super helpful. I have a question. How can I run IRR when it is a mixture of ordinal and binary data? Some of my variables are coded as yes/no while others are pretty much like likert scale.
Thanks!
You need to provide additional details before I am able to respond. Also, why do you want to perform IRR when the rating scales are so different?
Charles
Thank you for this rich and fruitful demonstration, but I’d like to ask whether kappa statistic is useful in evaluating a diagnostic tool by agreement measurement with a golden standard tool?
I used to do so for my clients in addition to calculating sensitivity, specificity and predictive values. Thank you a lot!
You can use Cohen’s Kappa to measure agreement with a gold standard. Depending on the specific situation, Bland Altman can also be used. See the following webpage
Bland-Altman
The following is an interesting paper that describes many different approaches to reliability testing
https://orbi.ulg.ac.be/bitstream/2268/39575/1/vanbelle-thesis-5-5-2009.pdf
Charles
Hi,
how to compare two Cohen’s Kappa statistics based on the same sample of subjects but different raters? I wonder if there is a way to compare these two kappa statistics — that is, whether they are statistically different.
Thanks
Karina,
I found this paper online. Perhaps it will be useful.
http://hera.ugr.es/doi/16521778.pdf
Charles
Hi
Thank you for this page
I am unsure of how to calculate the sample size or if it required (i have read a lot of papers recently where no sample size is mentioned).
I am interested in testing a new scoring method for disease severity where severity is scored from say 1 to4 or 1 to3 from normal to most severe.
I will have two testers who are less experienced and two experts in the field doing this.
Unfortunately I don’t understand how to determine what sample size I might need to this. I intend to calculate kappa between the two ‘novices’ and the then the two ‘experts’ and then also test intra reader reliability for each.
All I have come across so far is very complicated mathematics !
Any help would be great
Hi,
The calculations do require some complicated mathematics. I will try to add software to calculate the sample size required for Cohen’s Kappa to the next release of the Real Statistics software.
Charles
Hi
Could you please provide it ? because its very important.
Hi Ahmed,what do you want me to provide?
Charles
Charles,
Thanks for the wonderful software that you given free to us all.
I chanced upon your site while reading about Cohen’s kappa.
I tried an example given in the free chapter of the book Wonders of Biostatistics,
where cell a is 40, b is 15, c is 10 and d is 35. While the kappa calculated by your software and the result given in the book agree, the standard error doesn’t match.
The book gives a value of 0. 08617, while the value calculated by your software is 0.086746758. The formula given at your site and in the book are the same. I tried the same example through excel myself (not using your software) and got the result the book gave. Is there an error in calculation or is there any other explanation?
Thanks,ajith
Ajith,
I would like to duplicate your results, but I don’t have access to the original data. In particular, I can’t find the free chapter in the book you are referring to and don’t know what cell d you are referring to (nor have you provided me with the value of kappa).
If you can email me an Excel file with the data and your calculations, I will try to figure out what is going on. See Contact Us for my email address.
Charles
There was result of my Cohen’s Kappa, κ = 0.593 in 95% CI, but in some books, results of Cohen’s Kappa, k= 0.593 (95% CI, 0.300 to 0.886), p < .0005. What does it mean? and the numbers 0.300 to 0.886 can be from where?
It means that Cohen-s kappa is .593, which is a value which indicates agreement, but not as high as some authors suggest shown satisfactory agreement, namely .7. But in any case, the actual value may not even be .593, but you are 95% confident that the value lies between .300 and .886. At the lower range agreement is poor, while at the upper range agreement is very good. p < .0005 indicates that you are very confident that Cohen's kappa is not zero. Charles
Sir,
How can we calculate 95% confidence interval from cohen’s kappa. PLease mail me
Example 2 of the referenced webpage shows you how to calculate a 95% confidence interval for Cohen’s kappa.
Charles
Hi Charles,
Thank you for your article on Cohen’s kappa. Is there a way to calculate Cohen’s kappa for each of the categories (i.e. disorders in your first example). In another post, you showed how Fleiss’ kappa is calculated for each disorders and I wonder if this can be done for Cohen’s kappa as well.
Thank you!
Maria,
I don’t know any way to do this.
Charles
Bonjour,
Je dois calculer, dans un premier temps, l’écart type de l’échelle d’évaluation appelé TRST (échelle comprenant 5 critères, de 1 à 5)
Sachant que mes données sont les suivantes :
TRST Nombre Pourcentage TRST Moyen
1 23 (patients) 6,12% 3,05
2 77 20,48%
3 105 27,92%
4 163 43,35%
5 8 2,13%
Dans un second temps, je voudrait trouver le Coefficient KAPPA pour chaque seuil du score TRST.
Après multiples calcul, aucune solutions n’a été trouvé…
Hi,
For a sample of 150 decision units, percentage agreement was 82% (123 out of 150), however Cohen’s kappa using SPSS was 83%. Is it possible to have kappa greater than percentage agreement? This has baffled me so much as I would generally not expect this. However, there were close to 10 categories on which decision has to be made. I realise that expected agreement by chance decreases the higher the categories but to what extent?
Thanks
If I am understanding the situation properly, this should not happen. Please let me know the category each of the two judges placed the 150 sample members (e.g. as in range B5:D7 of Figure 2 of the referenced webpage), so that I can see what is going wrong. It would be best if you could put it in an Excel spreadsheet and send it to my email address (see Contact Us).
Charles
Hi Charles,
I have a data set of two Physicians classifying (from category 1 to 8) 29 people. From the example (Figure 1 for Example 1) you have given it seems both the judges saying 10 psychotic, 16 Borderline and 8 Neither (Diagonals). But, what if Judge 1 says 10 Psychotic and Judge 2 says 15 Psychotic (or any number other than 10). How to calculate Cohen’s Kappa here?
In my data, according to Physician 1 there are 5 people in category 1, but according to 2nd Physician there are 8 people in the same category.
Kindly explain me how to calculate Cohen’s kappa in this case?
Bharatesh
I think you are interpreting the figure in a way that wasn’t intended.
Judge 1 finds 16 of the patients to be psychotic. Of these 16 patients, judge 2 agrees with judge 1 on 10 of them, namely he/she too finds them psychotic. But judge 2 disagrees with judge 1 on 6 of these patients, finding them to be borderline (and not psychotic as judge does).
Judge 2 finds that 15 of the patients are psychotic. As stated above, he/she agrees with judge 1 on 10 of these. 4 of the patients that judge 2 finds psychotic are rated by judge 1 to be borderline, while judge 2 rates 1 of them to be neither.
I hope this helps.
Charles
Yes! Got it now.
Thank you
Bharatesh
Hi Charles,
Can you please show me how to transfer the dataset below into the table format (2×2 since there are 2 responses (Reject vs. Accept) and 2 appraisers with 50 samples). Thanks.
Part Appraiser Response Standard
1 Anne A A
1 Brian A A
2 Anne A A
2 Brian A A
3 Anne R R
3 Brian R R
4 Anne R R
4 Brian R R
5 Anne R R
5 Brian R R
6 Anne A A
6 Brian A A
7 Anne R R
7 Brian R R
8 Anne R R
8 Brian R R
9 Anne A A
9 Brian R A
10 Anne A A
10 Brian A A
11 Anne R R
11 Brian R R
12 Anne R R
12 Brian R R
13 Anne A A
13 Brian A A
14 Anne R R
14 Brian R R
15 Anne A A
15 Brian A A
16 Anne A A
16 Brian A A
17 Anne A A
17 Brian A A
18 Anne A A
18 Brian A A
19 Anne R R
19 Brian R R
20 Anne A R
20 Brian R R
21 Anne A A
21 Brian A A
22 Anne R R
22 Brian R R
23 Anne A A
23 Brian A A
24 Anne A A
24 Brian A A
25 Anne R R
25 Brian R R
26 Anne A R
26 Brian A R
27 Anne R R
27 Brian R R
28 Anne A A
28 Brian A A
29 Anne R R
29 Brian R R
30 Anne R R
30 Brian R R
31 Anne A A
31 Brian A A
32 Anne A A
32 Brian A A
33 Anne A A
33 Brian A A
34 Anne R R
34 Brian R R
35 Anne A R
35 Brian R R
36 Anne A A
36 Brian A A
37 Anne A A
37 Brian A A
38 Anne A R
38 Brian R R
39 Anne A A
39 Brian A A
40 Anne A A
40 Brian A A
41 Anne R R
41 Brian R R
42 Anne R R
42 Brian R R
43 Anne A A
43 Brian A A
44 Anne A A
44 Brian A A
45 Anne A R
45 Brian R R
46 Anne R R
46 Brian R R
47 Anne A A
47 Brian A A
48 Anne A R
48 Brian R R
49 Anne A A
49 Brian R A
50 Anne R R
50 Brian R R
Minnie,
I am not sure what the fourth column represents, but I will try to answer your question referencing the first three columns. The key is to pair the rating from Anne with that from Brian for each of the 50 subjects. I’ll assume that the input data occupies the range A1:C100. I then do the following
1. Insert the formula =IF(ISODD(ROW(C1)),C1,””) in cell E1
2. Insert the formula =IF(ISEVEN(ROW(C2)),C2,””) in cell F1
3. Highlight range range E1:F100 and press Ctrl-D
This accomplishes the pairing. Now you can build the 2 x 2 table as follows:
4. Insert “A” in cell H2, “R” in cell H3, “A” in cell I1 and “R” in cell J1 (the headings)
5. Insert =COUNTIFS($E$1:$E$100,$H2,$F$1:$F$100,I$1) in cell I2
6. Highlight range I2:J3 and press Ctrl-R and then Ctrl-D
Charles
Hi Charles,
For this dataset, do you think if it is right if transferred as followed:
AA AR RR
AA 24 0 0
AR 0 26 0
RR 0 5 19
Thank you!
Sorry, but I don’t understand your question.
Charles
For Minnie’s dataset(above), I transferred the data into frequency table as following,
AA AR RR
AA 24 0 0
AR 0 26 0
RR 0 5 19
Do you think it is right?
I don’t really know. It depends on how to interpret the original data. Since there were 50 subjects in the original data judged presumably by two raters, I would expect that the sum of the frequencies in the frequency table would be 50 or perhaps 100. I don’t see this in the table you have provided, but perhaps I am not interpreting things in the way they were intended.
Charles
Hi.
This a great site.
I submitted my research to a journal. I provided the intra and inter examiner’s kappa, but one of the reviewers asked for the “average kappa” for my codes.
I had 5 examiners, 100 sample and 3different coding categories for each sample. How can I do this in SPSS? and what is the value of the average kappa for the codes?
Thank you very much for your help
Max
Max,
I am not an expert on SPSS, but from what I have seen SPSS does not calculate an average value for kappa. I have seen a number of different ways of calculating the average kappa. Also Fleiss’ kappa is often used instead (the Real Statistics package provides Fleiss’ kappa).
Charles
Hello Charles,
Is it possible to run an inter-rater reliability or agreement test with 2 coders, when the categories that are being rated (1=yes, 0=no) are NOT mutually exclusive?
Thanks
Alessi,
With two raters and categorical ratings, Cohen’s kappa is a good fit.
What do you mean by the “categories that are being rated (1=yes, 0=no) are NOT mutually exclusive”. Yes and no seem pretty mutually exclusive to me.
Charles
Can this Kappa statistic be used without testing hypothesis? Like the diagnostic test? Thank you.
Christia,
Yes, Kappa is a measure of agreement and does not need to be used as part of hypothesis testing.
Charles
Hi Charles
This is a nice website, it has been great help, thank you. I have a question: i´m performing a study: I have two raters, ten samples and five categories (1 to 5). Each rater measured each sample. All samples were scored five, i mean:
Rater B
Rater A 1 2 3 4 5
1 0 0 0 0 0
2 0 0 0 0 0
3 0 0 0 0 0
4 0 0 0 0 0
5 0 0 0 0 10
In this case, p0 = 1 and Pe = 1, and cohen´s kappa is K = 1-1/1-1 = ? , meaning that the proportion of observations in agreement is equal to the proportion in agreement due to chance. What does it mean? In this case I´m sure each rater answered correctly cause really all samples have a 5 category. The agreement was perfect but kappa does not indicate this level of agreement.
I appreciate your help.
Hi Alexander,
This is one of the oddities about Cohen’s Kappa. If both raters choose the same rating for all subjects then the value of kappa is undefined. If you shift only one of samples to agreement in another category then the value of kappa is 1 as expected. Fortunately this problem doesn’t occur often, but unfortunately there are other counterintuitive thuns about this measurement.
Charles
Hi, thank you so much for creating this post!
If it’s not too much to ask, could you kindly help me determine how I can apply Cohen’s Kappa for my research?
I have a very big set of statements (more than 2500) and I’ve asked 2 raters to identify the emotions being evoked in these sentences. There are 10 predefined clusters of emotions, so the coders just need to choose among these 10 emotions. But each statement can be coded with more than just 1 emotion, to a maximum of 3 emotions.
What would you advise as the best way to compute reliability in this case?
Thanks in advance!
Auee,
I have been trying to figure out a clean way of using Cohen’s Kappa. One idea, although not so elegant, is to assume that your categories are all subsets of the ten emotions with 1, 2 or 3 emotions and use Weighted Cohen’s Kappa. You then assign the (disagreement) weights so that if the two raters don’t agree on any emotions the weight is high (e.g. rater A picks emotions 1, 2 and 3 while rater B picks emotions 5 and 6), if they agree on 1 emotion the weight is lower (e.g. rater A picks emotions 1 and 2, while rater B picks emotions 1 and 3), if they agree on 2 emotions the weight is even lower (e.g. rater A picks emotions 1, 2 and 3 and rater B picks 1 and 2 only) and finally if they agree completely then the weight is zero (e.g. both raters pick emotions 1 and 2 or both raters pick only emotion 4). There are more possibilities, and you would need to determine the appropriate weight based on some ordering of disagreement. This is the best I can think of at the moment, although maybe someone else has a better idea.
Charles
I have two raters, and two categories (1 and 0). I need a Kappa calculation for each of my codes from a data set. My 2×2 table calculator worked perfectly until I came across a code that had too many zeros in the table.
The values are: 0 2
0 97
Obviously, the agreement is high ( only 2 / 99 are disagreements). However, the kappa calculator breaks down when zeros are multiplied, and I’m curious if there’s a way around this. Thanks for your help.
Cameron,
If you send me a spreadsheet with your data I will see whether I can find a way around the problem.
Charles
We have a data set where we a running kappa. We are trying to differentiate the appropriate use of “overall” & “average” kappa.
For example:
We had two raters that rated x number of variables. We ran this data in SPSS for overall kappa and received .445. When we did kappa for each variable and summed the results to get an “average” kappa, we received .377.
What are the rules about “overall” kappa and “average” kappa for x number of variables with two raters? Which one is more appropriate to use, the overall that the output provides in SPSS or is an average adequate?
Comments?
Michael,
I have only used overall kappa and have not tried to average kappa values, and so I don’t know how average values perform.
Charles
Hi Charles, to clarify can I use Fliess with over 100 raters? If I have two model approach with two options each (yes or no) for agreement,is there another procedure you suggest?
Hi Jorge,
Fleiss’s Kappa should work with over 100 raters.
Charles
Thanks for the simple explanation.
My question is: what do you do if the categories are not distinct? For example, I have two raters coding interview statements by a series of categories (e.g. learning style, educational content, multi-sensory learning). We want to establish a sense of inter-rater agreement but are somewhat confused as the categories are not distinct – each statement can be coded into multiple categories. What should we do?
Thanks!
Daniel,
One approach is to create one value of Cohen’s kappa for each category (using 1 if the category is chosen and 0 if the cateory is not chosen). A better approach might be to combine all the categories and use a weighted Cohen’s kappa. E.g. with the three cateories you described (which I will label L, E and M) you would have 8 different ratings none, L, E, M, LE, LM, EM, LEM, which would be coded as 0 through 7. You can now establish the desired pairwise ratings and use weighted kappa as described on the webpage https://real-statistics.com/reliability/weighted-cohens-kappa/
Charles
Could you explain how to calculate one value of Cohen’s kappa for each category? I have 5 categories and 2 raters.
Thank you.
Kelly,
If I understand your situation correctly (namely that the two raters are assigning a category to each subject), you create one value for Cohen’s kappa which cuts across all 5 categories. You can’t get a separate kappa for each category.
Charles
This is very useful site thanks for explanation about looking kappa statistic in different scenarios.
I have a question to do in my assignment there are 125 questions in rows, three vendors was rated by 10 raters in three scales 0-not good,3-good,6- very good, can you pl. explain how can I see agreement by raters have any bias or reliable.
Is Kappa statistic is valid for this hypothesis testing or ICC ?
Also, pl. send me the link to calculation worksheet or methodology.
I look forward to hearing from you soon.
Rita,
I don’t understand the relationship between (a) the 125 questions and (b) the 10 raters who rate 3 vendors (using ratings 0, 3 6). Please explain this more completely.
Depending on this explanation, I see three possible measures: ICC, Fleiss’s Kappa or Kendall’s W. All three are explained on the website.
You can download the software which calcuates all three at the webpage https://real-statistics.com/free-download/.
You can also see spreadsheets with the examples shown on the website at https://real-statistics.com/free-download/real-statistics-examples-workbook/
Charles
(second attempt)
There seems to be a mistake in
‘Observation: Since 0 ≤ pe ≤ pa and 0 ≤ pa ≤ 1, it follows that…’
The expected probability of agreement pe is not necessarily less than the observed probability pa (otherwise Kappa could never be negative).
The correct statement that Kappa can never fall below -1 arises from the fact that, in the case of minimum observed agreement (pa=0) the expected agreement pe cannot be more than one-half; therefore; the absolute magnitude of (pa – pe), i.e. the numerator in Kappa, is always less than or equal to (1 – pe), the denominator.
Jeremy,
I updated the referenced webpage a few weeks ago. I hope that I have now corrected the errors that you identified. Thanks for your help.
Charles
There seems to be a mistake in:
“Observation: Since 0 ≤ pε ≤ pa and 0 ≤ pa ≤ 1, it follows that…”.
pε can be larger than pa (otherwise Kappa could never be negative). The (correctly given) lower limit of -1 for the possible range of Kappa arises from the fact that (negative) deviations of the observed frequencies from expected are limited in size, since negative frequencies are impossible.
Jeremy,
I believe that you are correct, although I haven’t had the opportunity to check this yet. I plan to do so shortly and will update the webpage appropriately. Thanks for bringing this to my attention.
Charles
I want to compare the new test to the old one (but not the gold standard). Can I use Kappa test for this research? If yes, what is the formula to calculate the sample size for Kappa?
Connie,
You haven’t given me enough inofrmation to answe your question. The usual test for comparing two samples is the t test or one of the non-parametric equivalents, and not Cohen’s kappa. The t test and the sample size requirements for this test are described at https://real-statistics.com/students-t-distribution/. If you need help in using Cohen’s kappa, you need to provide some additional inoformation.
Charles
Two key formulas in Fig.3 are incorrect.
E10 should be SUM(B10:D10)
E11 should be SUM (B11:D11)
Jeremy,
Thanks for catching this mistake. I have just made the correction on the referenced webpage. Fixing errors such as this one makes it easier for people to understand the concepts and learn the material. I really appreciate your help in this regard.
Charles
Hi,
Can this be used if there are 2 raters rating only 2 items, using a 5 point ordinal scale? I keep getting errors/-1 values! Thank you
Hi Randeep,
I’m not sure how useful it is is, but I just tried using Cohen’s kappa with 2 raters and 2 items using a 5 point scale and it worked fine. The kappa value was negative, but that is possible. If you send me a copy of your worksheet I can investigate further to see if there is an error.
Charles