Basic Concepts
Let U be any m × m orthogonal matrix, and so, by definition, UTU = I. Let L′ = LUT and Y′ = UY. Then L′ is a (k × m) × (m × m) = k × m matrix and Y′ is a (m × m) × (m × 1) = m × 1 column vector. Also
X = μ + LY+ ε = μ + LUTUY + ε = μ + L′Y′ + ε
E[Y′] = E[UY] = U E[Y] = U0 = 0
var(Y′) = var(UY) = U var(Y) UT = UIUT = UUT = I
cov(Y′, ε) = cov(UY, ε) = U cov(Y, ε) = U0 = 0
This shows that if L and Y satisfy the model, then so do L′ and Y′. Since there are an infinite number of orthogonal matrices U, there are an infinite number of alternative models.
A rotation of the original axes is determined by an orthogonal matrix U with det = 1 (Property 7 of Orthogonal Vectors and Matrices). Thus, replacing Y with Y′ is equivalent to rotating the axes. This won’t change the overall variance explained by the model (i.e. the communalities), but it will change the distribution of variances among the factors.
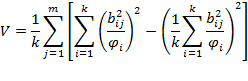
We seek an m × m rotation matrix U = [uij] such that the rows represent the existing factors and the columns represent the new factors. The most popular rotation approach is called Varimax, which maximizes the differences between the loading factors while maintaining orthogonal axes. Varimax attempts to maximize the value of V, where
 There are also non-orthogonal rotations that do a better job of differentiating the factors, but at the cost of a loss of orthogonality.
We can carry out the Varimax orthogonal rotation in standard Excel as described in Varimax Algorithm. Since the calculation is complicated and time-consuming, we suggest you use the following array function.
Worksheet Function
Real Statistics Function: The Real Statistics Resource Pack provides the following function, where R1 is a k × m range in Excel.
VARIMAX(R1): Produces a k × m array containing the loading factor matrix after applying a Varimax rotation to the loading factor matrix contained in range R1.
Referring to Figure 2 of Determining the Number of Factors, we now use VARIMAX(B44:E52) to obtain the rotated matrix for Example 1 of Factor Extraction as shown in Figure 1.

Figure 1 – Loading factors after Varimax rotation
We now see that each of the variables (including Motivation), with the single exception of Entertainment, correlates highly with only one factor. Also, note that the communalities (column M) are the same as those shown in Figure 2 of Determining the Number of Factors before rotation.
Using Gaussian Elimination
We can also calculate the rotation matrix U that transforms the matrix in Figure 2 of Determining the Number of Factors into that in Figure 1. We do this by using Gaussian elimination (see Determinants and Linear Equations). To avoid the time-consuming steps required in standard Excel, we first create a copy of the original loading factors (from Figure 2 of Determining the Number of Factors) and insert a copy of the rotated loading factors (from Figure 2) right next to it, as shown in Figure 3.

Figure 2 – Preparation for Gaussian elimination
We next apply the Real Statistics function =ELIM(A57:H65) to get the result shown in Figure 3.

Figure 3 – Rotation Matrix
The 4 × 4 rotation matrix U is now found in the upper right portion (range E67:H70) of Figure 3. Note too that U is an orthogonal matrix (i.e. UTU = I) and det(U) = 1.
Links
Examples Workbook
Click here to download the Excel workbook with the examples described on this webpage.
References
Abdi, H. (2003) Factor rotations in Factor Analysis
https://www.utdallas.edu/~herve/Abdi-rotations-pretty.pdf
Penn State (2024) Varimax rotation
https://online.stat.psu.edu/stat505/Lesson12#varimax-rotation
Penn State (2024) Factor rotations
https://online.stat.psu.edu/stat505/Lesson12#factor-rotations
I tend to think Varimax rotation often oversimplifies the relationships in between the principal components. I suppose it is important notate this as something to watch out.
it is important to note … typo
Sir Charles
Thank You for this site with many important informations.
I have a dataset with ~ 90% dichotomous variables (51 dichotomous and 6 ordinals and 270 observations). I hope to get seven latent constructs in this study.
The KR20 in database was 0,71, but for each latent constructs varied arround 0,5 – 0,65.
Could I to use factorial analyses in this case?
I saw articles that used AFE with some dichotomous variables, but not many with in my study. In this cases they used oblique rotation and polychoric correlations and not recommend to use maximum likelihood. Too they used the structure matrix for the loading analyses.
I so sorry for some grammatical faulty.
Thank You
Tizi
Tizi,
KR20 is only used with dichotomous variables. Since you have 6 ordinal variables, you should use Cronbach’s alpha instead. Cronbach’s alpha is equivalent to KR20 for dichotomous variables, but it also supports non-dichotomous data. When you say that KR20 is 0,71, I am not sure whether you meant Cronbach’s alpha = 0,71. Cronbach’s alpha (or KR20) should only be used when the variables are measuring the same underlying concept (essentially the same latent construct).
As you clearly understand, one reason for using factor analysis is to identify latent factors. If you have 7 latent factors and could map each of the original variables to these factors, you could then separate your original data into 7 data sets and calculate Cronbach’s alpha for each one. You would expect these 7 values of Cronbach’s alpha to be higher than one value of Cronbach’s alpha based on the complete data set. If not, it is questionable how useful your factor analysis was or even if it was done correctly.
Given that Cronbach’s alpha for all the data was already in what is commonly viewed as the acceptable range (namely higher than 0,7), perhaps you really only have 1 or 2 latent factors (instead 7).
I can’t comment on whether it is better to use oblique rotation, but can only say that the Real Statistics software doesn’t yet support oblique rotations. Also the version of the software was not oriented toward dichotomous data and so recommendations you read about may indeed be more appropriate for your analysis.
Charles
Dear Charles,
Thank you for your contributions.
Hi
This website is fantastic! It has helped me so much with my dissertation.
I tested the correlation between the principal components and the standardized original variables and only 5 out of 11 were highly correlated (>0.4 or <-0.4) so I used the Varimax function. Now 10 out of 11 are highly correlated to one PC, but 1 is not highly correlated to any of the PCs. Can I still go ahead with PCA or is this a problem, and if so is there anything I can do about it?
Many thanks
Sam
Sam,
That is actually an excellent result. It is not unusual for some of the original variables not to highly correlate with one factor. You can simply proceed with this this result as is or drop the problem variable from the analysis.
Charles
site’s great but i am abit over my abilities in algebra.specifically
what results can you get using matrix U.How can it be of use?How to report findings?
Essentially this part of the webpage says that you can rotate the model (represented by L and Y) by any number of degrees and still get a valid model. The orthogonal matrix U represents any such rotation. The only U that is important in this context, however, is the Varimax rotation, which in some sense is the best rotation for the purposes of factor analysis.
Charles
Thank you for this fantastic resource!
I understand that different rotation procedures optimize simple structure according to different criteria. I have wondered if one can optimize on a subset of variables. For example, I want to see the clearest possible distinction between three of my variables, but I’m not so concerned about the others. In the Varimax solution there would be an attempt to optimize over all variables, which may not produce the optimal differentiation for the subset. Of course, we would want the transformation matrix to satisfy the usual constraints. Any thoughts on this?
Laura,
When you say that you want to optimize on a subset of the variables, do you mean “variable” or “factors”? If “variable”, then you could simply leave out the variables that are not of interest (although you would lose some information about the variables you want to retain). Perhaps I don’t understand well enough what you want to achieve, but I don’t know of any technique that would achieve this.
Charles
Laura, you could try to apply a so called “special transformation” which may give you a rank of variables according to their importance, so would be able to make better distinction between them.
How account total of rotation?
Please explain better. I don’t understand your question.
Charles
Hi,
If the matrix U is an orthonal matrix it should be square – having the same number of rows as columns, right? and not m x p…
Mads
Hi Mads,
That is correct. An orthogonal matrix is a square matrix. I have corrected the referenced webpage since the matrix U on that page should be a square matrix. Thanks for catching the error.
Charles
Sir
(1)In the 3rd paragraph you wrote:”Thus, replacing and by is equivalent to rotating the axes.” What does “replacing” and “by” means?
(2)In the paragraph below figure 1 you wrote:” We now see that the each of the variables (including Motivation) correlates highly with only one factor.” But it seems “Entertain” is an exception.
Colin
Colin,
(1) It should read replacing Y by Y’
(2) Yes you are correct
Thanks for catching both of these errors. I have now revised the webpage to reflect these changes.
Charles