The following example is used on the Factor Analysis web pages.
Example
Example 1: The school system of a major city wanted to determine the characteristics of a great teacher, and so they asked 120 students to rate the importance of each of the following 9 criteria using a Likert scale of 1 to 10, with 10 representing that a particular characteristic is extremely important and 1 representing that the characteristic is not important.
- Setting high expectations for the students
- Entertaining
- Able to communicate effectively
- Having expertise in their subject
- Able to motivate
- Caring
- Charismatic
- Having a passion for teaching
- Friendly and easy-going
We now display the data for the entire 120-person sample, starting with the first 60 rows.
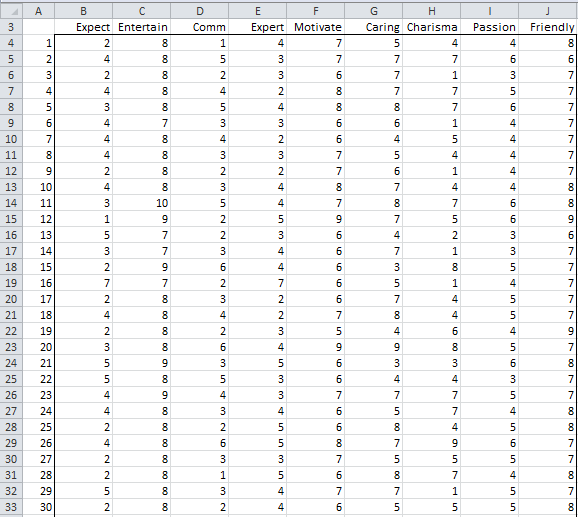
Figure 1a – Sample (part 1)
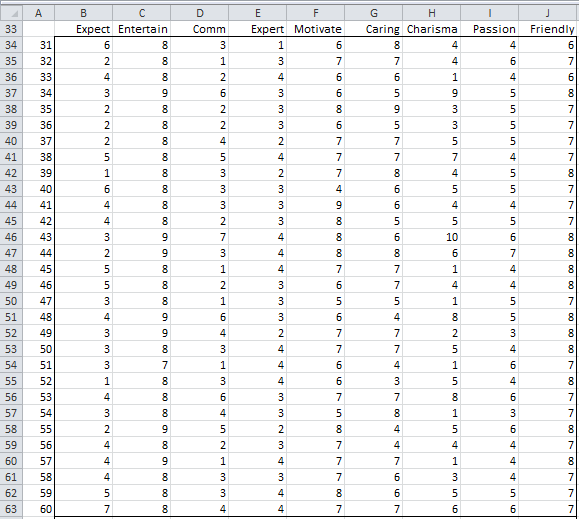
Figure 1b – Sample (part 2)
The last 60 rows of data:
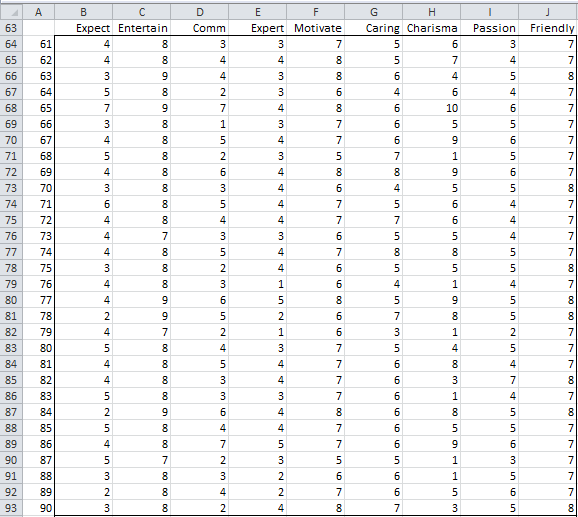
Figure 1c – Sample (part 3)
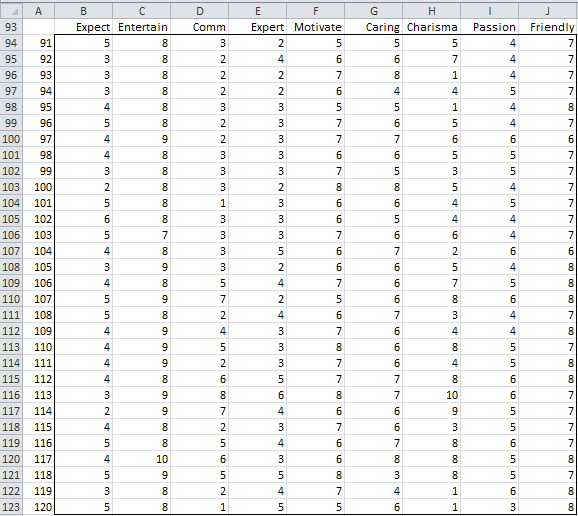
Figure 1d – Sample (part 4)
Descriptive Statistics
Figures 2 and 3 provide some characteristics about this sample.
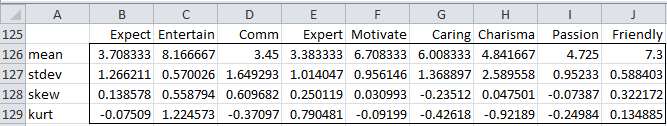
Figure 2 – Descriptive Statistics
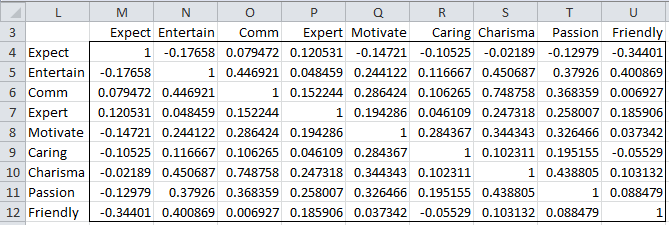
Figure 3 – Correlation Matrix
Factor Analysis
The actual factor analysis based on the sample data is provided on subsequent web pages.
Examples Workbook
Click here to download the Excel workbook with the examples described on this webpage.
Links
References
Rencher, A.C., Christensen, W. F. (2012) Methods of multivariate analysis (3nd Ed). Wiley
Penn State University (2022) Factor analysis
https://online.stat.psu.edu/stat505/Lesson12
so, what is the final output of this example? what are the conclusions and results of this?
The final output is described at
https://real-statistics.com/multivariate-statistics/factor-analysis/real-statistics-support-factor-analysis/
You can get more details using the links at
https://real-statistics.com/multivariate-statistics/factor-analysis/
Charles
Charles, Is there more to this example? It currently stops at the Correlation Matrix on the webpage. I imagine there is much more and I wonder if there might be a bug on this webpage.
on principal components analysis states that you can actually use eigenvectors as coefficients of regression. can you do that with factor analysis too?
I believe in factor analysis this is covered on the following webpage
https://real-statistics.com/multivariate-statistics/factor-analysis/factor-scores/
Charles
ok! so , on worksheet ‘Factor’ we produce Y at cells ce6:ce9 with regression method using bv6:by14… but can we use rotated bv46:by54? which is better?
Sorry, maybe i shouldn’t have used addresses but i do not know how to name X and Y.
the address described is a 10×4 X – a version of Xs after varimax rotation.So can you use *it* to get the 4×1 Y via regression in the same way as it is illustrated with the original X
(also how do you call X & Y – there is some factor-analysis terminology i need to clarify)
I am sorry, but I don’t understand your comment.
Charles
Could you please also put the dataset for downloading (Great Teacher Dataset). Thank you!
Hello David,
It is already available, as are all the data sets. Download the Multivariate Analysis file from the following webpage:
Real Statistics Examples Workbooks
Remember that almost all the datasets on the website contain fictitious data designed to best illustrate the specific statistical analysis.
Charles
Charles, what age are the students in the sample? Thanks, David
Hello David,
This data was invented by me, and so no age was considered. With very few exceptions, all the data on the website is made up.
Charles
This is a great tip especially to those fresh to the blogosphere.
Simple but very accurate info… Thanks for sharing this one.
A must read article!
Am writing to ask fir help because am doing research but on reaching chapter 4 am really stack especially in factor analysis and reliability. How do o go about
I am not sure what Chapter 4 refers to, but you can learn more about Factor Analysis and Reliability at
Factor Analysis
Reliability
Charles
Hello. Do the number of discrete levels for each variable in this type of analysis have to be the same? For example what if one of the questions had a scale of say only 1-3 rather than 1-10?
Azar,
I don’t see why the scale needs to be the same for all the questions. Essentially the data is being treated as continuous and so the more elements in the scale the better.
Charles
Thanks for your response.
Hi, I have a data sheet of survey I am trying to do factor analysis and T Test, everytime I am getting problem either with lower KMO Value or higher T Test result.
Please advise there is any process to check the working on excel instead of SSPS
Pawan,
Sorry, but I don’t understand your question.
Charles
Sir I am doing factor analysis using the tool but there is showing numerical error in sqrt(diag) and partial correlation matrix. Please help me for getting KMO value.
Jitendra,
If you send me an Excel file with your data and analysis I will try to figure out what is happening. You can find my email address at
Contact Us.
I have observed that sometimes a numerical error is generated when the square root of a negative number is calculated. This is correct for calculations such as =SQRT(-2), but is not desirable for calculations such as =SQRT(-.000000000001), which should really return zero.
Charles
Hello sir, a have a research work on factor analysis titled; correlation between pupils performance and factors affecting their performance. please, how can I work on this? Thanks, even as I await your response.
Anule,
This is a very broad question and depends on lots of things that you haven’t explained in your question. The devil is in the details.
Charles
where the rest of solution of above example
Ahmed,
If you look to the right of the referenced webpage, there is a list of Factor Analysis topics, the rest of the solution is distributed among the webpages corresponding to these topics.
Charles
hi sir, how am i get data set in the picture into excel?
Novika,
You can look at the examples workbook. You can download this for free from
https://real-statistics.com/free-download/real-statistics-examples-workbook/
Charles
Hello Sir,
thank your amazing Explanations,thus i was wondering if you could give us the file of data that you performed on it the Factor Analysis .
Best Regards ,
Bahlat Bilel
Hello Bahlat,
You can download this as described on the webpage
Real Statistics Examples Workbook
Charles
Dear Sir,
Thanks for the tutorial. It’s very useful. Still, i have a problem in my research using factor analysis. My result on KMO’s test didn’t meet the requirement to be proceed with factor analysis.
I have 16 main factors and 100 samples. I have to get the results of my questionnaire and the results showed that more than half of the data does not meet the criteria for further processing. Could you please tell me what should i do next?
I would be great if you could response my question.
Rizal
Rizal,
The usual approach with a low KMO is to delete the variables with a low KMO. Sometimes the low KMO indicates that the sample size is too small. You could also be in a situation where the data is not very suitable for factor analysis (no natural grouping into hidden variables).
I suggest that the first thing you do is eliminate one or more of the variables with the lowest KMO and see whether that improves the situation. Keep doing this until you get a good result or you feel that you have eliminated too many variables.
You could always proceed with the factor analysis despite a low KMO, but if the KMO indicator is as it is advertised, I wouldn’t count on getting very good results from the factor analysis.
Some additional information can be found at:
http://www-01.ibm.com/support/docview.wss?uid=swg21479963
Charles
hi, any hints about non-orthogonal axis case
as in
http://www.utdallas.edu/~herve/Abdi-rotations-pretty.pdf
I thought they are intended to calculate coordinates of a set of variables prooved to be correlated and are meant to be this way after data-reduction.Can you provide us with a better explanation?
Will you consider including such a case within the awesome real-statistics.com?
Do you have any useful references for your audience?
I will eventually add non-orthogonal transformations/rotations. The idea of these rotations is to better capture the characteristics of the data even at the loss of orthogonality (i.e. keeping the axes perpendicular). Once I work on this I will provide a more complete explanation. The references I have listed in the Bibliography that cover Varimax usually also cover non-orthogonal rotations, but I am not sure any of them really explain how to perform the calculations necessary.
Charles
very useful .. but how can it be interpreted? how many or which factors in the given example should be removed and which should be kept in the tool? and on what basis?
These topics are covered in the other Factor Analysis webpages. In particular, see Basic Concepts for how to interpret the analysis and Determining the Number of Factors regarding how many factors to keep.
Charles
Dear Sir,
I am waiting for your kind response to my last message. It would be really helpful for me getting your response!!
Alam
Dear Sir,
Many thanks for your clear explanation that is exactly as like I have thought.
I will get back to you, if I need any further help.
Regards,
Alam
Dear Sir,
For my PhD research, I am trying to find the correlation between girls’ attitude towards mathematics and nine main factors: F1……F9. The data will be collected by Likert type five point rating scale.
Can you please tell me what statistical analysis I can use to find the relationship of attitude and the factors. I need to know the name(s) of the statistical analysis process. Also kindly tell me how easily I can do it. Will SPSS be better or any other easy way to do it by Excel?
It would be a great help for me, if you kindly reply ASAP.
Alam
Alam,
It really depends on what your objective is. If you just want to find the correlation between girls’ attitude towards mathematics and each of the nine main factors, you can simply calculate nine correlation coefficients. If you want to determine whether any of these is different from zero, then you would need to perform a statistical test (probably based on Spearman’s or Kendall’s correlation coefficient). If you want to use these 9 factors as predictors of girl’s attitudes then you would need to use some form of Regression. I could go on. First you need to determine what you really want to demonstrate before I can give you a definitive answer.
Charles
Dear Sir,
Many thanks for your clarifications.
Actually, my collected data will be similar to the example you have placed above. Tell me what possible measurements can be used in my case of research about finding the relationship (correlations) of girls’ attitude towards mathematics and the predicted 9 factors. If I need to use regression analysis, please give me a brief idea on what I will get from this? Obviously in PhD level research varieties of possible analysis should be used. However, give me a list names of such statistical analysis so that I can practice those beforehand.
Regards,
Alam
Alam,
I guess I don’t understand your question since it seems that you are trying to conduct a factor analysis, but your question doesn’t seem to be connected to factor analysis.
Charles
Dear Sir,
Sorry to bother you again. To make my question clear, I have attached the attitude measurement scale/ the survey questionnaire. Could you please look at it and kindly give me some suggestion about the statistics I should use to analyse the collected data from about 200 children among which 50% will be girls and 50% will be boys. Other characteristics will be the different types of schools such as, govt. non-govt., girls’ school, boys’ school, coeducation school, religious school, urban school, rural schools. I want to see what are the differences in children’s attitudes towards mathematics the different school context and the relationship of attitude with the nine predicted factors.
I will eagerly wait for your kind response.
Regards,
Alam
Alam,
Let’s take the simple case first. If you want to determine whether there is a significant difference between boys and girls in their overall score (maximum 60 points), just do a two sample t test or Mann-Whitney analysis of all the girls versus all the boys.
If you want to test whether the type of school matters, you can do a two factor ANOVA where factor 1 is gender (boys, girls) and factor 2 is school type. Since your school types are overlapping you may need to run several ANOVA one for govt vs non govt, another for coed vs non coed, etc.
If you do several analyses you need to make a experimentwise correction factor as explained on the website (the more analyses you run the more likely you will find a significant result even if there is none).
Are the nine factors C, A, F, M, U, MD, S, T, EM? If so then you need to analyze these separately (or as another ANOVA factor). Here you are probably using the scores that the students got on just that factor.
As you can see we are using the word “factor” in different ways.
Charles
Dear sir,
Please check your gmail account. I have sent an attachment to you.
Alam
sorry i wold like to know how can i use spps in analysing pre and post data base on serviCe
Meaning is that to measure relationship and DIFFRENCIES of pr service enjoyment and after service enjoyment
I am not familiar with SPSS, and so I cannot comment. I can comment on Excel and the Real Statistics Resource Pack for Excel.
Charles
Sir,
Kindly present comment on Figure 2, Figure 3.
Are the values are significant?
What is correlation values between variables and how much value show results are significant.
significance of skew and kurt?
Ada bukunya gak gmana cranya pakek analisis faktor secra manual?
Sorry but I don’t understand your question.
Charles
he asks any suggestion of book for calculating factor analysis manually
Wan,
The Real Statistics website describes how to calculate factor analysis manually.
Charles
Hi Charles.
Thanks for the great tutorials. could you please help how to make a decision after having all the tables, factors & PCAs ? how can we convert all these numbers into decision ? sorry but I am very new to stat and doing PCA & FA first time.
Essentially Factor Analysis reduces the number of variables that need to be analyzed. If you started with say 20 variables and the factor analysis produces 4 variables, you perform whatever analysis you want on these 4 factor variables (instead of the original 20 variables). The input data to the analysis is the orginal data to which you need to apply the factor scores, as described on the webpage https://real-statistics.com/multivariate-statistics/factor-analysis/factor-scores/. I will try to better explain this on the website shortly.
Charles
How do you construct a correlation matrix?What is the significance of the values in the matrix?
how do you interpret the results?
The objective of factor analysis is to describe the interrelationships among a large number of variables and to explain these variables in terms of a smaller number of common underlying dimensions. This involves finding a way of condensing the information contained in some of the original variables into a smaller set of implicit variables (called factors) with a minimum loss of information. This provides better insight about the original information makes it easier to perform subsequent analyses (based on a smaller set of variables).
How do you construct the correlation matrix as in fig.3 above using excel?
The simplest way is to use the Real Statistics array function CORR. For the data on the referenced webpage the correlation matrix is calculated by the array formula =CORR(B4:J123).
You can also construct the correlation matrix for the data in the m x n range R1 in Excel as follows. Let R2 be the 1 x n range containing the means of the columns in R1 and let R3 be the 1 x n range containing the population standard deviations of the columns in R1. The correlation matrix for R1 can be calculated by the array formula
=MMULT(TRANSPOSE(R1-R2),R1-R2)/COUNT(R1)/MMULT(TRANSPOSE(R3),R3)
This approach only works if R1 does not contain any missing data.
If you want to perform the calculation in pure Excel then you can If there is no missing data in the range R1 you can use the following Excel formula:
See the webpage https://real-statistics.com/multiple-regression/least-squares-method-multiple-regression/ for more information.
Charles
Thanks!