In Factor Extraction, we describe how to calculate the loading factors L, but we still need to find the values of the factors, namely Y, which correspond to values of the explicit variables X.
We show three methods for calculating the factor scores.
Regression Method
If we look at Definition 1 of Basic Concepts of Factor Analysis, we recall that the factor analysis model is based on the equations:
![]()
![]()
Using the sample instead of the population, we have
![]()
![]()
We find the values of the factors using the method of least squares employed in multiple regression (see Least Squares Method of Multiple Regression). In particular, our goal is to find the value of Y that minimizes ||E|| based on the values in the sample for the explicit variables X.
The least squares solution (Property 1 of Least Squares Method of Multiple Regression) is
![]()
Note that since this regression doesn’t have a constant term, we don’t need to add a column of 1’s to L as we did in Property 1 of Least Square Method of Multiple Regression. Now LTL = D, where D is a diagonal matrix whose main diagonal consists of the eigenvalues of S. Thus (LTL)-1 is the diagonal matrix whose main diagonal consists of 1/λ1, ⋯, 1/λk.
We define the factor score matrix to be the m × k matrix F = (LTL)-1L = [fij] where
![]()
and where C1, …, Cm are the orthonormal eigenvectors corresponding to the eigenvalues λ1, …, λm.
Recall that L = [bij] is the k × m matrix such that bij = 


 Example
For example, the factor score matrix and factor scores for the first sample (see Figure 1 or Figure 6 of Principal Component Analysis) for Example 1 of Factor Extraction are shown in Figure 1.

Figure 1 – Factor score matrix using the least-squares method
Here the factor score matrix (range BV6:BY14) is calculated by the formula =B19:E27/SQRT(B18:E18) (referring to cells in Figure 2 of Factor Extraction), the sample scores X (range CA6:C14) is as in Figure 1 or 6 of Principal Component Analysis, X′ (CC6:CC14) consists of the values in X less the means of each of the variables and is calculated by the formula =CA6:CA14-TRANSPOSE(B128:J128) (referring to Figure 2 of Principal Component Analysis). Finally, the factor scores Y corresponding to the scores in X (range CE6:CE9) are calculated by the formula
=MMULT(TRANSPOSE(BV6:BY14),CC6:CC14)
Actually, since we reversed the sign of the loadings for factor 1, we need to reverse the sign for the factor scores for factor 1 (i.e. column BV). This results in a change of sign for factor 1 (i.e. CE6). The result is shown in Figure 2.

Figure 2 – Revised factor score matrix
Similarly, we can calculate the factor scores for the entire sample (see Figure 2 of Principal Component Analysis). The result for the first 10 sample items is shown in Figure 3. Note that we are now showing the X as row vectors (instead of column vectors as was employed in Figure 2), and so the factor scores are calculated by
![]()

Figure 3 – Factor scores of the sample using least squares
Here, the factor scores for the entire sample are shown in range CH19:CK38. They are calculated by the formula =MMULT(B4:J123-B126:J126, BV19:BY27), referring to cells in Figure 1 of Principal Component Analysis and Figure 2.
Bartlett’s Method
Bartlett’s method of creating factor scores is similar to the least-squares method except that now the reciprocals of the specific variances are used as weighting factors. This gives more weight to variances with high community (and therefore low specific variance).
As before, we seek a Y such that
![]()
But this time, instead of minimizing
![]()
we try to minimize
![]()
where V is the diagonal matrix whose main diagonal consists of the specific variances. This produces factor scores satisfying
![]()
For Bartlett’s method, we define the factor score matrix to be the m × k matrix
![]()
and so the factor scores for a sample X are given by
Example
For Example 1 of Factor Extraction, the factor score matrix and calculation for the first sample using Bartlett’s method are shown in Figure 4.
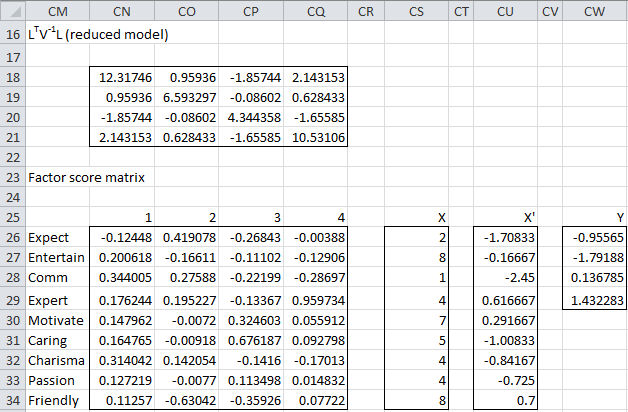
Figure 4 – Factor scores using Bartlett’s method
Here, LTV-1L (range CN18:CQ21) is calculated by the array formula
=MMULT(TRANSPOSE(B44:E52),MMULT(MINVERSE(DIAGONAL(Q44:Q52)),
B44:E52))
We calculate the factor score matrix (range CN26:CQ34) using the formula
=TRANSPOSE(MMULT(MINVERSE(CN18:CQ21),MMULT(TRANSPOSE(B44:E52
MINVERSE(DIAGONAL(Q44:Q52)))))
The rest of the figure is calculated as in Figure 2. Similarly, we can calculate the factor scores for the entire sample (see Figure 2 of Principal Component Analysis). The result for the first 10 sample items is shown in Figure 5 (note that we are now showing the X as row vectors instead of column vectors as was employed in Figure 4).

Figure 5 – Factor scores using Bartlett’s method
Here, the factor scores for the entire sample are displayed in range CZ19:DC38, as calculated by the formula =MMULT(B4:J123-B126:J126,CN26:CQ34), referring to cells in Figure 1 of Principal Component Analysis and Figure 4.
Anderson-Rubin’s Method
In this method, the factor scores are not correlated. This method produces factor scores satisfying
![]()
We define the factor score matrix to be the m × k matrix
![]()
and so the factor scores for a sample X are given by
Example
To calculate the factor matrix for Example 1 of Factor Extraction using Anderson-Rubin’s method, we first find the matrices shown in Figure 6.

Figure 6 – Preliminary calculations for Anderson-Rubin
All these matrices are calculated using standard Excel matrix functions, as we have seen previously (see, for example, Figure 4), with the exception of
![]()
This requires finding the square root of a positive semidefinite matrix as described in Positive Definite Matrices. To avoid carrying out the complicated calculations, the following array function is provided in the Real Statistics Resource Pack:
Worksheet Function
Real Statistics Function: The Real Statistics Resource Pack provides the following array function, where R1 is a k × k array or cell range in Excel.
MSQRT(R1): Produces a k × k array which is the square root of the matrix represented by R1
Thus, range DR12:DU15 is calculated using the formula
=MINVERSE(MSQRT(DF17:DI20))
The factor score matrix and calculation for the first sample using Anderson-Rubin’s method are shown in Figure 7.

Figure 7 – Factor scores using Anderson-Rubin’s method
The factor score matrix (range DF26:DI34) is calculated using the formula
=TRANSPOSE(MMULT(DR12:DU15,DR5:DZ8))
The factor scores for the first 10 sample items are shown in Figure 8 (note that, as before, we are now showing the X as row vectors instead of column vectors as was employed in Figure 7).

Figure 8 – Factor scores using Anderson-Rubin’s method
The factor scores (using any of the methods described above) can now be used as the data for subsequent analyses. In some sense, they provide similar information to that given in the original sample (Figure 1 of Principal Component Analysis), but with a reduced number of variables (as was our original intention).
Note that exploratory factor analysis does not require that the data be multivariate normally distributed, but many of the analyses that will be done using the reduced factors (and factor scores) will require multivariate normality.
Worksheet Function
The Real Statistics Resource Pack provides the following worksheet array function.
FAScore(Rd, Rf, Rm): returns a k × n array containing the factor scores associated with the k × m array of the data in Rd based on the m × n array of factor scores. If Rd doesn’t contain the original data used to calculate the factor scores in Rf, then the m × 1 array of the mean vector for the original data is used. Otherwise, only the first two arguments are used, and Rm is set to the mean vector of the data in Rd.
For example, the array formula =FAScore(B4:J123, CN26:CQ34) can be used to calculate the results shown in CZ19:DC38 of Figure 5. You would get the same result by using the formula =FAScore(B4:J123, CN26:CQ34, CN26:CQ34).
Links
Examples Workbook
Click here to download the Excel workbook with the examples described on this webpage.
References
Johnson, R. A., Wichern, D. W. (2007) Applied multivariate statistical analysis. 6th Ed. Pearson
https://mathematics.foi.hr/Applied%20Multivariate%20Statistical%20Analysis%20by%20Johnson%20and%20Wichern.pdf
Rencher, A.C., Christensen, W. F. (2012) Methods of multivariate analysis (3nd Ed). Wiley
its helpful for my lerning
Thanks for the website https://real-statistics.com/multivariate-statistics/factor-analysis/factor-scores/
I checked the result of factor scores from real-statistics and SPSS software and found the difference is the minus signs assigned to the first two factors, see the link below. However, I read only the first factor that should be multiplied by the minus sign in this website:Actually since we reversed the sign of the loadings for factor 1, we need to reverse the sign for the factor scores for factor 1 (i.e. column BV). This results in a change of sign for factor 1 (i.e., CE6).
But, we have not seen any loadings with minus multiplication for factor 1, know the png below. Any reason for that is we should know?
Hello,
I would have to see your data and the analysis that you performed to be able to answer your question.
If you send me an Excel file with this information, I will try to answer your question.
Charles
I am doing factor analysis on a dataset evaluated on a 5-point Likert scale. I had 18 attributes and I got 6 factors (using PCA as extraction method and eigen values>1). Then I applied Varimax for rotated component matrix and saved the factor scores as variables (using regression method).
What all I can apply using these factor scores for further analysis and interpretation?( I also have demographic data of the users such as age, gender, etc)
Can I use these factor scores as dependent variables and any demographic variable (say, age) as independent variable and run ANOVA ?
Hello Devika,
Yes you can use these values in ANOVA as you described.
Charles
Thanks a lot Charles.
If my normality assumption is getting violated, can I use non parametric test such as Kruskal Wallis on the obtained factor scores (factor scores are saved as variables using regression method).
Sir, (1) do we combine factor scores and form an independent variable? or (2) do we combine that items / questions that load on to a factor and form an independent variable (using SPSS)? If so, how do we do this? Thank you very much
Hello Azad,
Sorry, but I don’t completely understand your question. I also don’t use SPSS ad nd so I don’t know how this would be done in SPSS.
Charles
Sir,
This site is a very informatie site for researchers. I thank you a lot because this site have helped me a lot of times. If it is ok to you, I have a question about factor scores:
I used self organizing map to cluster factor scores. I used 5 variables for clustering and at the end, I have 4 clusters. In output, some means of factor scores (for every each subscale) are negative. How am I supposed to interpret these negative factor scores? Do I have to ignore negative factor scores and focus on positive ones? Ignoring negative factor scores is a very good approach for me otherwise interpretation process can be impossible for me.
Mehmet,
I don’t see any reason why factor scores can’t be negative. You interpret them in the same way as positive factor scores.
I don’t really understand the context of your question. E.g. what is the relationship between factor scores and clusters?
Charles
can you point to the relation of factor loadings and factor scores?
The site is great
Savvas,
I don’t really understand your question. This webpage explains factor score and the following webpage explains factor loadings
https://real-statistics.com/multivariate-statistics/factor-analysis/basic-concepts-factor-analysis/
Charles
Charles,
Thank you for your very clear explanations. This is extremely helpful. The method described above, however, calculates the factor scores on the unrotated components. How would you calculate the scores after rotation?
Bernie
Hello. Thank you very much for developing this software. Are the factor scores for each of the samples calculated somewhere by the software, or do I have to do that by myself following your example?
David,
They are calculated for you as explained at
https://real-statistics.com/multivariate-statistics/factor-analysis/real-statistics-support-factor-analysis/
Charles
I am sure I’m being really stupid, but I can’t find it. I see the loadings, which I understand to be the contributions of each factor to each independent variable (expect, entertain, etc.) and I see an example in Figure 7 of the factors for one sample, but I don’t see where the results are for all samples.
Mr. Charles,
first of all i would like to introduce my self, my name is Harniaty, i really appreciate what have you write in this web specially for this topic. it’s very helpfull to answer what have my lecture ask me.
Hello Charles,
I have an analysis which requires doing two tasks in sequence: 1. PCA to reduce dimensions/variables, 2. use factor scores (from step 1) to cluster observations using k-means iterations.
I am using SPSS Modeler and found that all the factor scores (say from 1 to 5) are standardized. i.e. each has mean ~ 0 and sd ~ 1. My question is, whether using standardized scores will dilute the importance of the “few initial” principal components when doing iterations on k-means?
Can one obtain the un-standardized factor scores using the following formula:
For obs 1: Loading of var. X1 on F1*Value of X1 for obs 1 + Loading of var. X2 on F1*Value of X2 for obs 1 + .. + and so on ? Or are there any other methods to accomplish this.
Aditya,
Sorry, but I don’t have time to investigate whether using standardized scores will dilute the importance of the “few initial” principal components when doing iterations on k-means. I have presented the most common methods of creating factor scores. I am sure there are other approaches, but I can’t say whether the approach that you are suggesting will do.
Charles
Hello Charles,
Firstly, I would to thank you for taking the time to explain the fundamental of statistics. I have reviewed many statistics websites and yours is the most comprehensive and comprehensible.
While I understand your methodology for factor analysis, I do not understand why the final score for each factor for each of the 120 observations should be based on sum of all nine (9) characteristic of a great teacher. If the aim of the analysis was to determine which characteristics fall into factor 1, factor 2, etc, should the factor score not be based solely on the sum of the characteristics that fall within that factor?
For ex. for Factor 1, why do we not sum the product of the 120 standardized observations and the factor loadings for Entertainment, Communications, Charisma and Passion?
Please note that I have never performed Factor Analysis or PCA and I am currently trying to under it’s core concepts and determine if it can be used in my research analysis.
If I can use this analysis in my research, I need to be able to use the factor scores to conduct multiple linear regression analysis, so it’s important for me to understand the how the factor scores are developed and what is it’s physical interpretation.
Thank you in advance for your time and understanding.
Regards,
Kerolyn
Kerolyn,
Essentially the factor scores are a way of mapping the the data from the original variables into values for the factors. Thus by definition once you have the factor scores you can do further analyses using the factor values and not the values for the original variables.
Charles
Excellent!!, Awesome!!
Thank you so much for such a wonderful website sir.
Your website has immensely helped me clear a lot of my concepts and fundamentals.
I humbly request you to post a tutorial on Linear Discriminant Analysis and Structural Equation Modeling if possible.
Once again Thanks a lot!!
Truly Grateful
Regards
Raghavendra S Bendigeri
I am very happy to read that the website has helped you a lot. I plan to add Linear Discriminant Analysis and Structural Equation Modeling, but there always seem to be higher priority enhancements. The next major new features are going to relate to forecasting, time series analysis and repeated measures ANOVA using regression.
Charles
Dear Charles,
You are a great help for students like me who do not have any background in statistics. Currently, I am doing a factor analysis (unweighted least square) on some data (collected on different variables of health care access) through which I intend to make an index of accessibility of health for individuals in sample. In my analysis, I am getting three components/dimensions and their respective scores for individuals in samples. What if I add up these three different scores of individuals and say that individuals who have high aggregate score have higher access of health and vice versa. Is it ok going in such a way and if its wrong please suggest me some other ways. Thanks.
As long as they have the same scale or their implied weightings are consistent with what you think is correct, then I don’t see any problem with creating an aggregate score. You could have done the same with the raw data before you performed the factor analysis. Now whether those who have a high aggregate score really have higher access to healthcare and vice versa should really be tested (e.g. via regression) since a priori it isn’t necessarily true.
Charles
Sir
I use factor analysis of the realsatatistics pack 2.3.1 to calculate factor score matrix, but it seems the result is totally different with the example in this website.
Colin
Colin,
I don’t recall changing the method I am using to calculate the factor score matrix. If you send me a spreadsheet with your data and the results that were calculated I can check to see what happened.
Charles
Dear Sir,
I am very thankful to you for your tremendous effort for devoliping this addins in excel sheet which is very fruitfull for us. I have recently started analysing my data using this addin.
I want to know about the loading factor matrix. How to get full loading matrix from the eigenvalue and eigen vector.
Thanks.
The calculation of the full loading matrix is described on the webpage https://real-statistics.com/multivariate-statistics/factor-analysis/factor-extraction/ based on the basic concepts described on the webpage https://real-statistics.com/multivariate-statistics/factor-analysis/basic-concepts-factor-analysis/.
Charles
Can you clarify whether standardized values for x are to be used when calculating y? It looks like you are using the non-standardized values, yet the tutorials on the previous steps calculated the eigen-vectors and loadings using standardized (at least with respect to variance) data. If your eigen vectors and loadings come from normalized data, then you need to use normalized data when calculating the y that corresponds to a given x, right?
David,
Clearly I standardized in performing the principal component analysis, but I can’t recall whether I did the same in the factor analysis example. I will take a look at what I did there and get back to you.
Charles
I have found your website very helpful in terms of walking me through factor analysis (I’m implementing the process in another language.)
Two notes:
1. In the introductory section of this page you have: “L = [bij] is the k × k …” I think you mean to say “L = [bij] is the m × k …”
2. When explaining the least squares method, you have “Now LTL = D where D is a diagonal matrix whose main diagonal consists of the eigenvalues of S. Thus LTL-1 is the diagonal matrix whose main diagonal consists of 1/λ1, ⋯, 1/λk.”
For clarity, you should put the “-1” outside of parentheses to indicate you are taking the inverse of the whole product rather than multiplying the transpose of L by its inverse. (I know, obvious to someone who knows what is going on, but could sidetrack people who reading things literally.)
David,
Thanks for catching both of these typing errors. L is actually a k x m matrix and (LTL)-1 should definitely be expressed with the -1 outside the parentheses.
Charles
Sir
In the function MSQRT(R1), it seems that must be a symmetric matrix, why?
Colin
Colin,
In the cases we are considering R1 represents a positive definite matrix, which as described in the following webpage means that it is symmetric.
https://real-statistics.com/linear-algebra-matrix-topics/positive-definite-matrices/
Charles