Rows Example
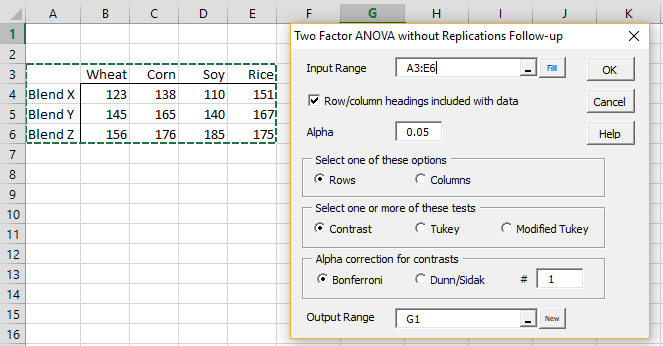
Example 1: Determine whether there is a significant difference between BlendZ and the mean of BlendX and BlendY for Example 1 of Two Factor ANOVA without Replications (the data is repeated on the left side of Figure 1 below).
Figure 1 – Two Factor ANOVA without Replications Follow-up dialog box
To conduct the analysis, press Ctrl-m and select Two Factor ANOVA Follow-up without Replications from the Anova tab (or the Analysis of Variance dialog box if using the original user interface). Fill in the dialog box that appears as shown on the right side of Figure 1. Upon pressing the OK button the output in Figure 2 is displayed except that initially, all the contrast coefficients in the shaded range V4:X4 are all blank.
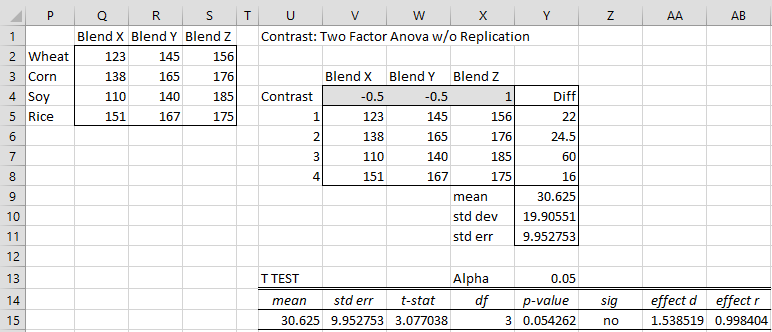
Figure 2 – Contrasts on the Rows factor
Now manually fill in the contrast coefficients shown in range V4:X4 and the other values in the figure will change to reflect these contrast coefficients. We see (cell Z15) that there is no significant difference between BlendZ and the mean of BlendX and BlendY.
Key formulas used in Figure 2 are shown in Figure 3.
| Cells | Entity | Formula |
| P2:S5 | transpose | =TRANSPOSE(A3:E6) |
| Y5 | contrast | =SUMPRODUCT($V$4:$X$4,V5:X5) |
| Y9, U15 | mean | =AVERAGE(Y5:Y8) |
| Y10 | std deviation | =STDEV(Y5:Y8) |
| Y11, V15 | std error | =Y10/SQRT(COUNTA(Y5:Y8)) |
| W15 | t-stat | =U15/V15 |
| X15 | df | =COUNTA(Y5:Y8)-1 |
| Y15 | p-value | =T.DIST.2T(ABS(W15),X15) |
| Z15 | significant | =IF(Y15<Y13,”yes”,”no”) |
| AJ10 | Cohen d | =ABS(Y9)/Y10 |
| AK10 | effect r | =SQRT(U15^2/(U15^2+X15)) |
Figure 3 – Representative formulas from Figure 2
Columns Example
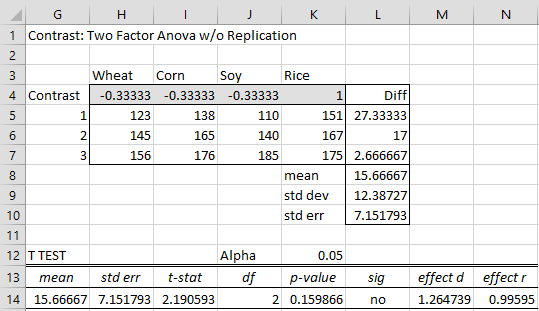
Example 2: Determine whether there is a significant difference between Rice and the mean of the Wheat, Corn and Soy cereals for the data in Figure 1.
The process is similar to that used in Example 1, except that this time we choose the Columns option in the dialog box shown in Figure 1 and insert the contrast coefficients shown in range H4:K4 of Figure 4.
The output shown in Figure 4 indicates that there is no significant difference between Rice and the mean of Wheat, Corn and Soy.
Figure 4 – Contrasts on the Columns factor
Note that there is no need to transpose the rows and columns as was done in Figure 3.
Examples Workbook
Click here to download the Excel workbook with the examples described on this webpage.
Reference
Howell, D. C. (2010) Statistical methods for psychology (7th ed.). Wadsworth, Cengage Learning.
https://labs.la.utexas.edu/gilden/files/2016/05/Statistics-Text.pdf


How are the contrasts used in V4:X4 determined?
Hello Marco,
The goal was to test the difference between “BlendZ and the mean of BlendX and BlendY”. To do this we assign the coefficient 1 to BlendX and -1 to the average of BlendX and BlendY. This is achieved by assigning -1/2 to BlendX and -1/2 to BlendY.
Charles