We now show how to use the Real Statistics Two Factor ANOVA Follow-up with Replications data analysis tool to create contrasts for two-factor ANOVA. There are two main advantages of this approach over one-factor analyses:
- The two-factor ANOVA model accounts for more of the variance, and so the error term MSE is smaller
- Information about the interaction between factors is available
Caution: You should only calculate the contrasts that you are interested in. Testing too many contrasts raises the familywise error rate to an unacceptable level. You can control the familywise error rate, but this risks a serious loss of power.
Example
Example 1: A research team has investigated whether mosquitoes bite specific parts of the body (arm, neck, foot) more often than others and whether there are differences depending on the climate of the room (cold, dry, humid). Five people were studied for each combination, with the number of bites recorded in the table shown in Figure 1.

Figure 1 – Data for Example 1
We conduct a two-way ANOVA using the Real Statistics data analysis tool with the output shown in Figure 2.
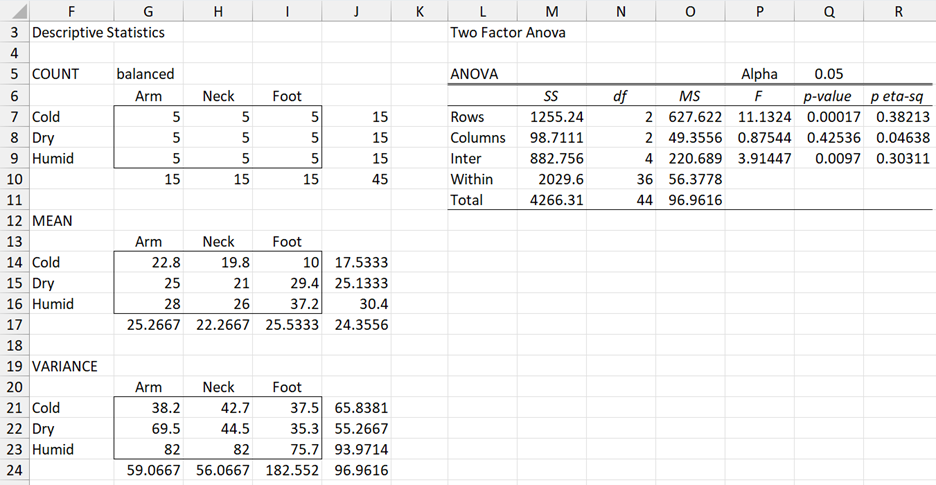
Figure 2 – ANOVA output for Example 1
From the ANOVA report, we see there are significant differences between the climate and interaction means, but not between the body parts.
Using the data in Figure 2, determine whether there are significant differences between the number of bites (a) in cold and humid climates, (b) to the arm and feet, (c) to the arm and foot in humid climates, and (d) to the foot in cold and humid climates.
Cold vs. Humid
To determine whether there is a significant difference between the number of bites in cold and humid climates, press Ctrl-m and select the Two Factor ANOVA with Replications Follow-up option from the Anova tab. Fill in the dialog box that appears as shown in Figure 3 and press the OK button.
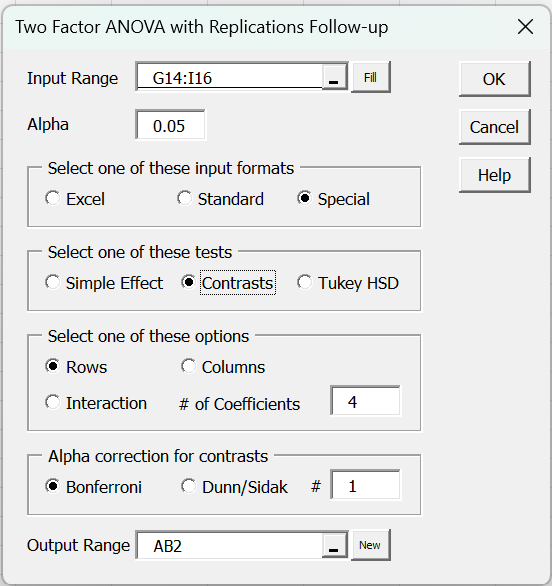
Figure 3 – Two Factor ANOVA Follow-up dialog box
We have three options for how to tell Excel where to find the data for the follow-up analysis. We chose the Special option. In this case, we insert the mean interaction data from the Two Factor ANOVA output (namely, range G14:I16 from Figure 2). We choose the Rows option for Contrasts since we want to compare Cold and Humid.
If we had chosen the Standard input format, then we would insert the data from Figure 1 reformatted in standard format. If we had chosen the Excel input format, then we would have inserted A4:D19 (from Figure 1) in the Input Range on the dialog box in Figure 3. (In this case, the data is first converted into standard format.)
Upon clicking on the dialog box’s OK button, the output shown in Figure 4 is displayed (except that initially, the contrast coefficients in the shaded range are all blank).

Figure 4 – Comparison of cold vs. humid
Since we are interested in Cold vs. Humid and the mean for Humid is larger than that for Cold, we place a 1 in cell AC6 and a -1 in cell AC4.
Here the standard error (cell AB10) is based on the value of MSW = 56.3778 (cell O10 of Figure 2). Since p-value = .3.83E-05 < .05 = α, we conclude there is a significant difference between the number of bites in cold and humid climates, thereby addressing Example 1(b).
Arm vs. Feet
As we saw in Figure 2, there is no significant difference between the number of bites by parts of the body. Thus, it is not necessary to perform a contrast analysis for arm vs. feet.
Arm vs. Feet in Humid climates
We again use the Two Factor ANOVA with Replications Follow-up data analysis tool, filling in the dialog box as shown in Figure 3. For this contrast, we need to instead select the Interaction option. Since we only need two contrast coefficients (as shown in range AC60:AE62 of Figure 4), we can change the # of Coefficients field from 4 to 2.
We place the -1 in the Arm × Humid cell and the 1 in the Foot × Humid cell. The output is shown in Figure 5.

Figure 5 – Comparison of arms vs. feet in humid climates
Since p-value = .06 > .05 = α, we conclude there isn’t a significant difference between the number of bites on the arm and feet in humid climates, thereby addressing Example 1(c).
Observation: As you can see from Figure 5, interaction contrasts are based on comparing the interaction means. There are two types of interaction comparisons: confounded and unconfounded. E.g. we can compare the means of Cold-Arm (cell AC60) with Dry-Foot (cell AE61), but even if there is a significant difference, we can’t tell whether this is due to a difference in the climate or a difference in the part of the body that the mosquitoes bit. This is an example of a confounded comparison. Confounded comparisons differ in both factors. We won’t try to analyze these.
Feet in Cold vs. Humid climates
We again use the Interaction option. As we can see in Figure 6, this time there is a significant difference.

Figure 6 – Comparison of feet in cold vs. humid climates
Familywise Error
Note that we needed to perform three contrasts in Example 1. To reduce the familywise error, we can use Bonferroni’s correction factor and employ an alpha value of .05/3 = .01667 instead of .05. This is done by changing the # field of the Alpha correction from 1 to 3. The conclusions arrived at in this case don’t change. If you prefer, you can click on the Dunn-Sidak correction option instead.
More complicated example
Example 2: Using the data in Example 1, determine whether there are significant differences between the number of bites in the arm or neck in cold and humid climates.
All the tests used in Example 1 are pairwise contrasts. This time, we need to use more complicated contrasts. We again choose the Interaction option, but because we will use 4 contrast coefficients, as shown on the left side of Figure 7, we need to use the default # Contrasts field of 4 on the dialog box in Figure 3.
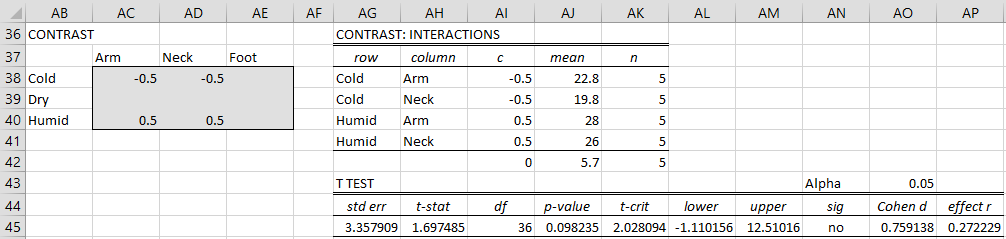
Figure 7 – More complicated comparison
We see from the right side of Figure 7 that there is no significant difference.
Links
↑ Follow-up to two-factor ANOVA with replications
Examples Workbook
Click here to download the Excel workbook with the examples described on this webpage.
References
Howell, D. C. (2010) Statistical methods for psychology (7th ed.). Wadsworth, Cengage Learning.
https://labs.la.utexas.edu/gilden/files/2016/05/Statistics-Text.pdf
Hello,
I wonder why there is no “Contrast – no correction” option in my dialog box. I only have Contrast with correction. Is it because I am using an old version of the software or a Mac?
Hello Mayi,
Actually, it just the reverse. The webpage is displaying an older version of the dialog box.
I will fix this in the next few days and present the current version of the dialog box and update how to fill in the dialog box.
Thanks for bringing this problem to my attention.
Charles
Dr. Charles,
Thank you for your dedication to make this site, it´s great!
My question is about the skewness, how to deal with, to avoid a type I error. The hypothesis to be tested is whether the type of plant material influences, as well as the treatment applied in the extraction of phytohormones, as well as if both factors improve this extraction.I have 4 groups, the data are small (n=3), have normal distribution (Shapiro), and are homoscedastics (Levene: medians and means) and the test didn´t show outliers. I applied Two Factor ANOVA with replications, the result were significant for both factors, not significant for interaction. But the doubt about the skewness for the later comparisons still remain, because are positive and negative marked asymmetries (-1.22, 1.70, 1.72, -1.47).
So, In order to improve this, Do you reccomend generate bootstrap samples for each group (like one sample case explained, here in your site), for later request two factor ANOVA with replications and then the follow up Contrast, for controlling the family wise error rate?
Or am I just making the case more complicated? and my samples not neeed all of this
Thanks for you advice
Laura
Hello Laura,
With such a small sample (n=3), I wouldn’t expect much from any of the tests. Even the results of a normality test are suspect. Power will also be very low (and, so who knows, you may have an interaction effect, although it is not large enough to be detected). In general, skewness shouldn’t be a problem; otherwise, the normality assumption would fail.
Charles
heyy nothing happens when i press ctrl + m? how to make it work?
Are you using the Mac or Windows version of Excel?
Charles
For the realstats contrast fxn, how do you know whether to select rows vs columns or the number of coefficients?
Thank you for all your help.
Hi Ian,
Sorry, but I don’t understand your question.
Charles
Charles,
What is the best way to analyze the cause of a significant interaction? In the mosquito bite example, if the Means are graphed it appears Cold Foot is out-of-line. Can Cold Foot be “blamed” for the strong interaction if it has significant contrast with adjacent results (Dry Foot and Cold Neck)? Thanks.
Dave,
The typical statistical tests are measuring differences or correlatiob, not causality. None of these tests by themselves test for “blame” or “cause”.
Charles
Charles,
Thank you for this wonderful add-in. I have just started to use it to analyse some data – proportion of insects emerged under different treatments. In your view, is it ok to analyse proportions in a two factor ANOVA?
My data appear to be normally distributed, with a few outliers. The Levene’s test is significant for means, but not medians. Is the analysis acceptable under these conditions?
When I carry out the two factor analysis with replication on the whole dataset, rows, columns and interactions are all not significant. When I remove the outliers, then rows are significantly different. Is this reliable, or should I try a transformation of the whole data?
Many thanks,
Cathy
Cathy,
Generally the median version of Levene’s test is used, but it is a judgement call as to whether you have fulfilled the homogeneity of variances assumption. For a two factor ANOVA there is no easy solution when this assumption is not met, and so I would likely error on the side of using the test.
When you say that you have a few outliers, are these outliers in a statistical sense (i.e. outside the expected range of values for the normal distribution) or are they outliers in the sense that the values are outside the range of values that you would expect based on your knowledge of the insects under study or based on previous studies? If the former and not the latter, then I would tend to accept the results that you got, especially since you met the normality assumption despite the presence of the outliers (if I have understood this correctly).
Charles
Dear Charles,
Thankyou for your reply. The outliers were not on the line of the Q-Q plot, so I thought they were outliers in a statistical sense. They were not entirely outside the range of values that might be possible for this insect, but unusual. So from your reply, I should accept the initial analysis which indicated no differences in rows, columns and interactions, rather than the analysis where I removed the outliers. Is this correct? Thank you. Cathy
Cathy,
I don’t have the experience in your field to say for sure, but based on your comments it does appear that the analysis including “outliers” is appropriate. In these situations, you can report the results of both analyses.
Charles
Thank you Charles. I left another comment elsewhere about analysis of egg numbers in two devices, but now I can’t find where I left that comment! Did you see it?
Regards,
Cathy
Yes and I sent you a reply, which I am repeating here:
Cathy,
There is no fool-proof method for determining normality. I tend to rely on Shapiro-Wilk. Generally, it is superior to d’Agostino except when there are a lot of ties. Some of the statistical tests that require normality are pretty robust to violations of normality especially when the data is symmetric. d’Agostino is a good test for symmetry (actually the skewness test upon which d’Agostino is based is even better in this case).
Charles
Hello, I love your website and it helped me for months creating my own custom tool and understanding it. But now I´ve got a question: I can do the contrasts for your climate-bodypart-example. It it necessary to know if the numbers are done with repetition or not? Is there a difference of contrasting an ANOVA with and without repetition? The main problem is: I do an Two-Factor ANOVA without Repetition and want to know where the differences are with the help of contrasts. Is your example with the bodyparts-and climate with repetition or without. Or it doesn´t matter at all, and its universal? I get the same contrast results if I do it for a 2F-ANOVA with repetition. But how can I contrast an ANOVA without repetition? Its the last thing I need to know.
I hope you undestand my question.
Hello Charles,
Why are the results from the contrasts lethid different from the ones you would get with one-way ANOVA (or even a t-test)?
I remember struggling with that concept in University as well 🙂
Any good video/read you could recommend?
Many thanks!
Fref
sorry, I had a better look, it seems we are looking at the difference between the two means we are interested in, divided by (the SSw multiplied by sqrt(1/n1+1/n2)). We are then getting a t statistic and look for the corresponding t-value. It will sink in, some day…:-)
Fred,
The difference is that the variance used is the one from the two factor ANOVA (i.e. MSE).
Charles
Dear Doctor Zaiontz,
I would like to conduct a planned test, but a question: could the analysis be done when token numbers are not the same? I mean, for example, 24 tokens for males and 28 for females. Many thanks!
Rebecca
Rebecca,
The samples don’t need to be the same size to use contrasts.
For two factor Anova with unequal sample sizes start by performing the two factor ANOVA using the Regression option. Then use this output for the contrasts as described on the referenced webpage.
Charles
Hi Doctor Zaiontz,
After a non significant two way ANOVA (gender x generation), I ran the planned cmparison and Tukey tests to compare the group means of 10 university male and 10 university females , but the result was not significant. I tried Mann-Whitney test and then finally got the result I expected. But can I report the result of non parametric test after a non significant two-way anova? What would you suggest? Many thanks!
Rebecca,
Generally, if you got non-significant result for the two-way ANOVA, you don’t need to (and should not) do any other tests.
That you found a significant result from Mann-Whitney is not too surprising since after so many tests, the real alpha is much higher than the original .05 (experiment-wise error).
Charles
Hello Charles:
You do easy to understand the hard things. Thank you so much!!!
Best regards
Felix