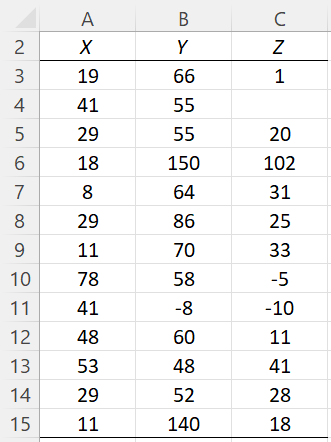
On this webpage, we describe in detail the Descriptive statistics option of the Real Statistics Descriptive Statistics and Normality data analysis tool. We use the example data shown in Figure 3 of the Descriptive Statistics and Normality Tool, repeated in Figure 1 below.
Figure 1 – Example data
Descriptive statistics option
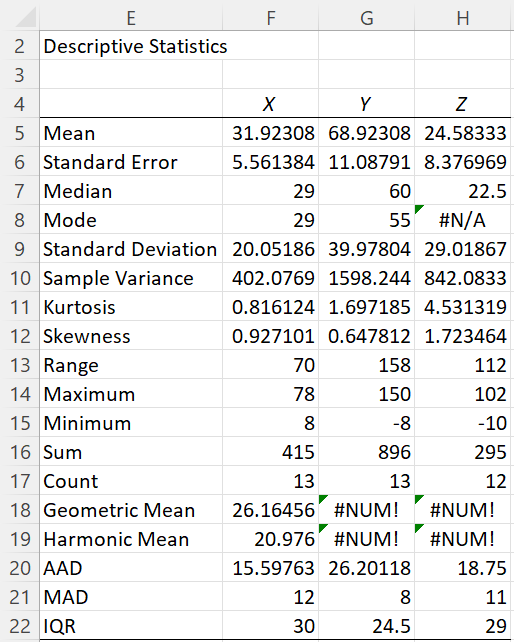
For each column in the Input Range (shown in Figure 1) various descriptive statistics are displayed for the data in that column. For the data in the figure, the output is shown in Figure 2.
Figure 2 – Descriptive statistics
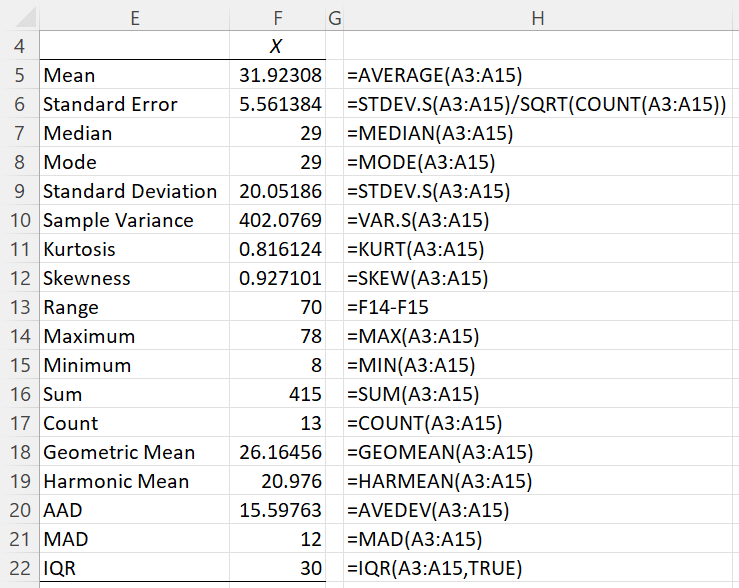
The formulas used to calculate the values for data set X, in column F, are shown in Figure 3.
Figure 3 – Descriptive statistics details
All these formulas use Excel worksheet functions except for Median Absolute Deviation (MAD) and the Inter-quartile Range (IQR), which use Real Statistics worksheet functions.
Details
If the Use exclusive version of quartile field in Figure 2 of Descriptive Statistics and Normality Tool were not checked, then the Inter-quartile Range (IQR) would use the formula =IQR(A3:A15,FALSE), and produce the values 23, 15, and 23 for the X, Y and Z data sets respectively.
Note that the Mode for data set Z is an error value since no data element is listed more than once. The Geometric Mean and Harmonic Mean for data sets Y and Z also produce errors since these data sets contain negative values.
If you change any of the values in Figure 1, the values output in Figure 2 will change accordingly. Any elements added to the data sets in Figure 1, however, will not be considered. If you replace any of the numeric values with a blank or non-numeric value, then this element will no longer figure into the calculation of the various statistics displayed in Figure 2.
See Descriptive Statistics Tools for more information about the Descriptive statistics option. See also Measures of Central Tendency, Measures of Variability, Symmetry, Skewness and Kurtosis, and Ranking Functions in Excel for more information about the worksheet functions described in Figure 3.


