We now describe worksheet functions in the Real Statistics Resource Pack that support Viterbi’s algorithm for Hidden Markov Models.
Worksheet Functions
The Real Statistics Resource Pack provides the following functions where Rp is a k × k transition matrix, Rd is a k × 1 initial distribution array, Rq is a k × m emission matrix, and Ro is an n × 1 sequence of observations.
HMM_Viterbi0(Rp, Rd, Rq, Ro): returns an n × k+k array, similar to that shown in range J3:O12 of Figure 1 of Viterbi Algorithm, with the output from the Viterbi algorithm.
HMM_Viterbi(Rp, Rd, Rq, Ro): returns an n × 1 array with the sequence of hidden states output from the Viterbi algorithm.
For Example 1 of Viterbi Algorithm, =HMM_Viterbi0(B3:D5,F3:F5,B8:D10,H3:H12) produces the output shown in range J3:O12 of Figure 1. The formula =HMM_Viterbi(B3:D5,F3:F5,B8:D10,H3:H12) produces the output shown in Q3:Q12.
Example
Example 1: The HMM shown on the left side of Figure 1 is used to characterize DNN coding. This toy example is taken from Gallier (2020). Given the observed genetic sequence shown in range G3:G11, find the most likely state sequence (H = high GC content, L = low GC content).
We use the HMM_Viterbi worksheet function, which uses positive integers for states and observations. Thus, we need to translate A, C, G, T into 1, 2, 3, 4. We do this by inserting the formula =MATCH(G3,B$6:E$6,0) into cell I3, highlighting range I3:I11, and pressing Ctrl-D. We next use the formula =HMM_Viterbi(B3:C4,E3:E4,B7:E8,I3:I11) to obtain the hidden state sequence shown in range K3:K11. Finally, we replace 1 and 2 with H and L by inserting the formula =INDEX(A$7:A$8,K3:K11) in cell M3, highlighting range M3:M11, and pressing Ctrl-D.
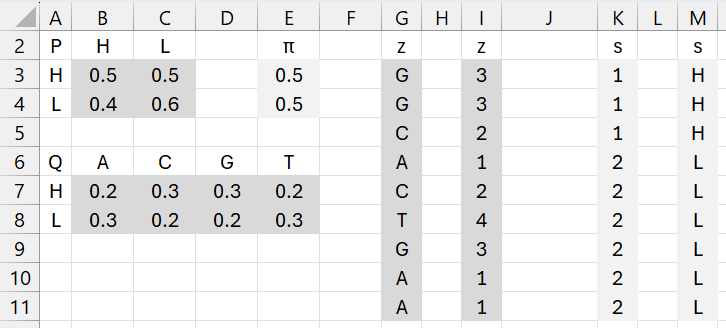
Figure 1 – Toy example
Another Worksheet Function
The Real Statistics Resource Pack provides the following function where Rp is a k × k transition matrix, Rd is a k × 1 initial distribution array, Rq is a k × m emission matrix, and Ro is an n × h array consisting of h sequences of observations, each of length n.
HMM_ViterbiX(Rp, Rd, Rq, Ro): returns an n × h array with the sequence of hidden states generated by the Viterbi algorithm.
Example 2: Repeat Example 1 with the observations in J2:S11 of Figure 2.
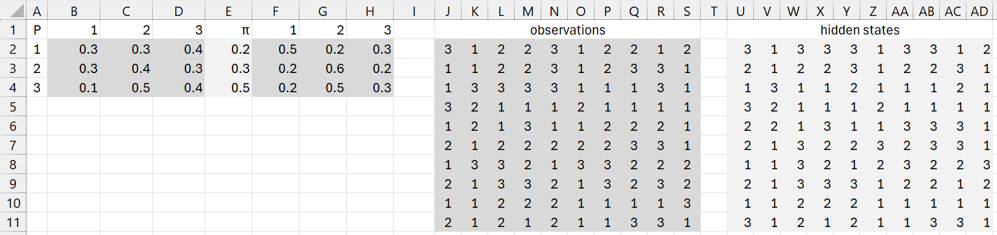
Figure 2 – Multiple observation sequences
Using the formula =HMM_ViterbiX($B2:$D4,$E2:$E4,$F2:$H4,J2:S11), we obtain the hidden states shown in range U2:AD11.
Links
Examples Workbook
Click here to download the Excel workbook with the examples described on this webpage.
References
Frazzoli, E. (2010) Intro to Hidden Markov Models
https://ocw.mit.edu/courses/16-410-principles-of-autonomy-and-decision-making-fall-2010/55e488318190f148c4ed211e2c96bada_MIT16_410F10_lec20.pdf
Gallier, J. H. (2020) HMM : Viterbi algorithm – a toy example
https://www.cis.upenn.edu/~cis2620/notes/Example-Viterbi-DNA.pdf
Ekisheva, S., Borodovsky, M. (2006) Probabilistic models for biological sequences: selection and maximum likelihood estimation
https://www.researchgate.net/publication/5800111_Probabilistic_models_for_biological_sequences_selection_and_Maximum_Likelihood_estimation