We now describe how to implement the ANCOVA-like analysis described in ANCOVA Light Basic Concepts in Excel by using Real Statistics capabilities.
Worksheet Function
Real Statistics Function: The Real Statistics Resource Pack provides the following array function to convert ANCOVA data in standard (stacked) format to a format useful for regression analysis. R1 contains ANCOVA data in standard format with 3 or 4 columns, with column 1 containing categorical values, column 2 containing values for the dependent variable, and column 3 (and optionally column 4) containing data for the covariant(s). We assume further that column 1 contains k distinct categorical values.
ANCOVA1Light(R1, head, center): outputs an array with the same number of data rows as R1; the first k–1 columns consist of the dummy codings for the categorical variable, the next column contains the values from the second column of R1, the next one or two columns contain the values for the covariant(s), and the remaining columns contain the values for the interaction between the dummy variables and the covariant(s).
If head = TRUE then the first row of R1 is assumed to contain column headings and is retained in the headings of the output. If head = FALSE (default) then R1 doesn’t contain a row of column headings; in this case, a row of headings is added to the output.
If center = TRUE (default), then the data corresponding to the covariant(s) is centered in the output (i.e. for each covariant, the mean for that covariant is subtracted from each covariant data value.
Referring to the figures in ANCOVA Light Basic Concepts, for the data in range A1:C25 of Figure 1, we can obtain the values in range E1:J25 of Figure 3 by using the array formula =ANCOVA1Light(A1:C25,TRUE,FALSE). We can obtain the values in range E1:J25 of Figure 5 by using the array formula =ANCOVA1Light(A1:C25,TRUE,TRUE).
Data Analysis Tool
Real Statistics Data Analysis Tool: The Real Statistics Resource Pack provides the ANCOVA Light data analysis tool to implement the type of analysis described in ANCOVA Light Basic Concepts.
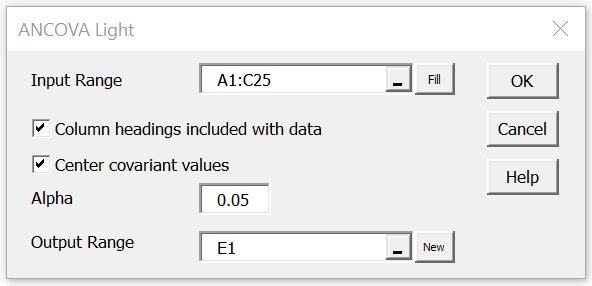
This data analysis tool can be used for Example 1 of ANCOVA Light Basic Concepts as follows. Referring to the input data in Figure 1 of ANCOVA Light Basic Concepts, press Ctrl-m and click on the Anova tab (if using the multipage interface or double-click on the ANOVA option if using the original user interface). Select ANCOVA Light and fill in the dialog box that appears as shown in Figure 1.
Figure 1 – ANCOVA Light dialog box
After clicking on the OK button, the output will be similar to that displayed in Figures 4 and 5 of ANCOVA Light Basic Concepts.
Examples Workbook
Click here to download the Excel workbook with the examples described on this webpage.
References
Seltman, H. J. (2018) Experimental design and analysis
https://stat.cmu.edu/~hseltman/309/Book/PrefTOC.pdf
PennState (2024) Unequal slopes model: salary example
https://online.stat.psu.edu/stat502/lesson/9/9.5
