Worksheet Functions
Real Statistics Functions: The Real Statistics Resource Pack provides the following functions in support of multivariate normal distributions.
BNORMSDIST(x, y, r, cum, don) = the cdf of the standard bivariate normal distribution at x and y with correlation coefficient r if cum = TRUE and the pdf if cum = FALSE
BNORMDIST(x, y, mx, my, sx, sy, r, cum, don) = the cdf of the bivariate normal distribution at x and y with means mx and my, standard deviations sx and sy and correlation coefficient r if cum = TRUE and the pdf if cum = FALSE
BNORMSRECT(x1, x2, y1, y2, r, cum, don) = P(x1 < x < x2 and y1 < y < y2) for the standard bivariate normal distribution with correlation coefficient r.
BNORMRECT(x1, x2, y1, y2, mx, my, sx, sy, r, cum, don) = P(x1 < x < x2 and y1 < y < y2) for the bivariate normal distribution with means mx and my, standard deviations sx and sy and correlation coefficient r.
MDistSq(R1, R2, R3): the Mahalanobis distance squared between the 1 × k row vector R2 and the 1 × k row vector R3 based on the sample data contained in the n × k range R1; if R3 is omitted then it defaults to the means vector for the data in R1.
MDistSq(R1, R2, R3, FALSE): the Mahalanobis distance squared between the 1 × k row vector R2 and the 1 × k row vector R3 based on the covariance matrix contained in the k × k range R1.
We have implemented two versions of the bivariate normal cumulative distribution: one by Donnelly and one by Genz (see references below). The Donnelly version is the default (when don = TRUE). The versions are quite similar for values of the correlation parameter when |r| < .925, but will tend to differ for other values of r.
Examples
Example 1: Assuming that the data in Figure 1 is bivariate normally distributed, estimate the parameters of the bivariate distribution and determine the pdf and cdf values of the vector (30,15) in this distribution.
We see from Figure 1 that the pdf at (30, 15) is .00109 and the cdf is .110764.

Figure 1 – Bivariate Normal Distribution
Example 2: Based on the data in Example 1, what is the Mahalanobis distance between (30,15) and the means vector and what is the Mahalanobis distance between this vector and (20,20)?
From Figure 2, we see that the distance between (30,15) and the means vector is 3.304. The distance between (30,15) and (20,20) is 3.683. This is calculated using both the raw data as well as the covariance matrix.
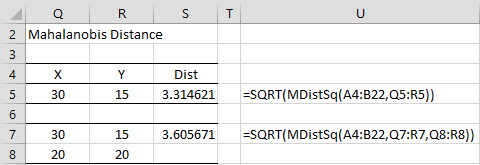
Figure 2 – Mahalanobis Distance
The array formula
=SQRT(MDistSq(D5:E6,Q11:R11,MEANCOL(A4:B22),FALSE))
can be used to calculate the value in cell S5 and the following formula can be used to calculate the value in cell S7.
=SQRT(MDistSq(D5:E6,Q13:R13,Q14:R14,FALSE))
References
Donnelly, T. G. (1973). Algorithm 462: Bivariate normal distribution. Communications of the ACM, 16, 638.
https://dl.acm.org/doi/10.1145/362375.362414
Genz, A. (2009) TVPack, Bivariate normal distribution
http://www.math.wsu.edu/faculty/genz/software/fort77/tvpack.f
Hull, J. C. Bivariate normal distribution calculator. University of Toronto
http://www-2.rotman.utoronto.ca/~hull/software/bivar.xls
Keisen Online Calculator (2021) Bivariate normal distribution calculator
No longer available online
Could you explain the algorithm in excel to find the cumulative probabilities from the standard bivariate normal distribution?
I would appreciate it very much
Hello Antony,
The algorithm is described on the Genz reference that you can access from the webpage.
Charles
I AM STUDYING THE FORTRAN ALGORITHM TO ESTIMATE THE CUMULATIVE PROBABILITIES OF THE BIVARIATE NORMAL DISTRIBUTION, THE RESULTS THAT I OBTAIN FROM THE FIRST PART OF THE ALGORITHM (BVN) WHEN I HAVE AN R 0.925 THE RESULTS I GET DO NOT MATCH THE ALGORITHM (SECOND PART OF THE DO FUNCTION), PLEASE CAN YOU HELP ME.
I match the result with the algorithm when I have r less than 0.925 (first part of the algorithm), but when I have r greater than 0.925 the result does not match the algorithm (second part of the do function), please help me, I am doing it in excel.
WITH A DH=1.38, DK=2.19 AND A R=0.925, I OBTAIN A BVN EQUAL TO 1.052781423
WITH A DH=1.38, A DK=2.19 AND A R=0.925 I OBTAIN A BVN OF 1.05278, THIS IS IN THE SECOND PART OF THE DO FUNCTION.
HELP ME PLEASE
Hello Antony,
What algorithm are you using?
Is it the most up-to-date algorithm for the bivariate normal distribution?
Charles
I AM USING THE ALAN GETS ALGORITHM IN FOLTRAN 77 TV PACK
Antony,
What do DH and DR refer to? I assume that you are comparing the results from BNORMDIST with those obtained from the FORTRAN TV Pack. Are you calculating the pdf or the cdf? Can you email me an Excel file with your data so that I can check things out?
Charles
apparently there is an error in real statistics for an R greater than 0.925
I HAVE SENT THE FILE TO YOUR MAIL.
Hello Antony,
I have researched this issue in more detail. The Genz algorithm for calculating the bivariate normal distribution cdf uses a different algorithm for values of r whose absolute value is bigger than .925. This is why the values are different from what is calculated by the usual algorithm. I am going to issue a new release of the Real Statistics software today that will provide an option for using the Genz algorithm or the usual Donnelly algorithm.
Charles
the genz algorithm is correct, apparently there is a programming error in the realstatistics.
Antony,
Are you saying that Real Statistics does not return the correct results for =BNORMSDIST(x, y, .95, TRUE, FALSE)?
If so, please give me an example of x, y, and the correct results.
Charles
Gentz’s algorithm produces correct results for r greater than or equal to 0.925. Apparently the algorithm code was transferred incorrectly to the real statistics.
Hello Antony,
For x = 2, y = 3, and r = .95, what do get for the the cumulative probability function (cdf) of the standard bivariate normal distribution? I get .97725.
Charles
using gentz’s algorithm the result is correct.
Dear Charles
I find the cdf of low percentile is not close to 0, for example
BNORMSDIST(NORM.S.INV(0.0001),NORM.S.INV(0.0001),0.1,TRUE) = 0.007971080
BNORMSDIST(NORM.S.INV(0.0001),NORM.S.INV(0.0001),0.9,TRUE) = 0.089108437
and at high percentile exceed 1, for example
BNORMSDIST(NORM.S.INV(0.9999),NORM.S.INV(0.9999),0.1,TRUE) = 1.007771080
BNORMSDIST(NORM.S.INV(0.9999),NORM.S.INV(0.9999),0.9,TRUE) = 1.088908437
Appreciate your advise on the correct setting for the function.
Thank you
Hello Wen-Yi,
Thank you for bringing this issue to my attention.
I found a bug in the BNORMSDIST function that I believe resolves this problem. I plan to do further testing and then will release a new version of the Real Statistics software with the correction. This will be Rel 7.8. I expect that this will become available in the next week or two.
I appreciate your diligence in finding this error.
Charles
Dear Editor,
It looks that if we have 5 variables to conduct 5000 multivariate normal simulations in excel, we have to first generate 1) vacov matrix, 2) cholesky decomposition matrix, 3) use realstat formula for each variable , one by one, respectively.
Is there any way to conduct 5000 multivariate normal simulations in a shorter way?
I need more information about your scenario to be able to answer your question.
Charles
Dear Mr, Charles,
Congratulations.
I went through all the material available at your useful website.
How to generate MVN – Multivariate Normal distribution using realstat module?
The menus shows many tabs inside Multivariate except MVN.
There is no data calculator for Cholesky at your website.
Please update
Regards,
H K bagh
You can use the CHOL function. See https://real-statistics.com/linear-algebra-matrix-topics/cholesky-decomposition/
Charles
Dear Mr, Charles,
Please provide some examples in excel for how to calculate weibull distribution and Mahanabolis.
Need to calculate manually. Please help it out. IF any free downloads excels for both.
Regards,
Taru
Sorry but I don’t understand your question.
Charles
Just 1 more question: the p value for Mahalanobis distance should be set to 0.001? Pls confirm. Thanks a heap!
Demos,
Yes, that is a common recommendation and I believe that is the threshold that SPSS uses.
Charles
Hello Mr Zaiontz, hope you are well.
It has been a while since I have touched any stats. But I am trying to remember how to do a multiple regression using real stats. I used to use SPSS and now trying to learn it using your great software.
However, I was a psych major and so struggle some times with some of the technical terms. I have got to the part where I understand that I can check for univariate outliers and influencers using the t-test and Cook’s distance respectively, followed by trimming/ winsorising.
I have tried entering the real stats formula into the excel sheet as per your real stats example part 1a, but to no avail. I have even tried copy pasting it, but as soon as I click on it, these brackets “{ }” disappear and then the PC states “you cannot change part of any array.” When I type the formula in as per your real stats example sheet, it only shows the winsorised data for 1 data point (in your example it would just show a 3). Was hoping you could tell me what I am doing wrong here.
I am struggling a little with identifying and managing multivariate outliers/ influencers. I remember from my SPSS days that I was using Mahalonobis distance to find and eliminate them. However, I don’t understand how to use it with real stats. Was hoping for some guidance here (I couldn’t follow what you were saying above). Unless you know of a way eg embedded within your multiple regression add-in? I am using your example in Real stats excel sheet example 2a, sheet Mult Reg 5. Thanks. Wishes for a good day.
Demos,
These formulas are what are called array formulas in Excel, and so they need to be treated a bit differently than other formulas. Note that array formulas are a standard part of Excel, but many people have never used them. See the following webpage for how to use these types of formulas:
https://real-statistics.com/excel-environment/array-formulas-functions/
Charles
Thanks! Was also hoping if you could help with my second query re Mahalanobis distance? Cheers.
Demos,
How to identify multivariate outliers using the Mahalanobis distance is explained on the following webpage>
https://real-statistics.com/multivariate-statistics/multivariate-analysis-of-variance-manova/manova-assumptions/
Charles
Hi Charles, so if I want to run a multiple regression and check for multivariate outliers, I have run the real stats MANOVA to check the Mahalonobis distance? PLs confirm.
Demos,
Currently yes. You would need to use the MANOVA data analysis tool, or alternatively duplicate that part of the functionality using the MDistSq function. Keep in mind that there is only one dependent variable when using multiple regression and so many of the calculations simplify (e.g. the covariance matrix is 1 x 1, i.e. a scalar).
Charles