On this webpage, we describe in detail the MAD Outliers option of the Real Statistics Descriptive Statistics and Normality data analysis tool. We use the example data shown in Figure 3 of the Descriptive Statistics and Normality Tool, repeated in Figure 1 below.
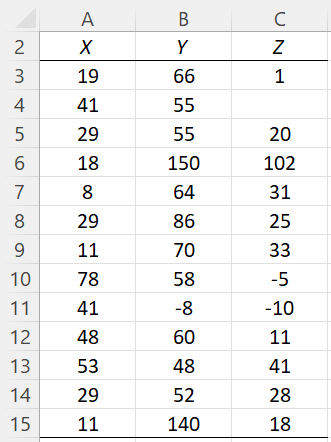
Figure 1 – Example data
MAD Outliers and Missing Data
The MAD Outliers option identifies potential outliers and missing data. Whether an element in a data set is flagged as an outlier is determined by the Outlier Limit field shown in Figure 2 of Descriptive Statistics and Normality Tool. The default for this field is 2.0, but you can change it to any value between 1.0 and 6.0.
An element in any of the columns in the Input Range is considered to be an outlier when the standardization, (x – median) / mad, of that element x based on the median and MAD for that column is greater than the value in the Outlier Limit field.
The output from this option when 2.5 is inserted in the Outlier Limit field is shown in Figure 2.
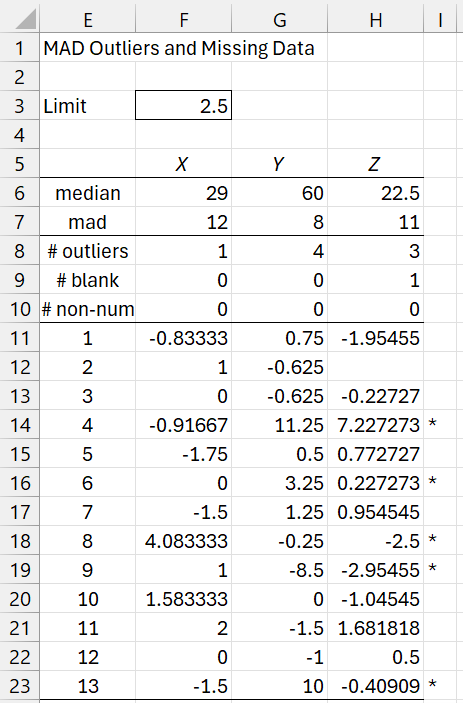
Figure 2 – MAD Outliers output
Missing Data
We see from rows 9 and 10 of Figure 2 that there is only one missing data element, namely a blank element in data set Z, which we can see is element #2; this corresponds to cell C4 from Figure 1. There are no non-numeric elements. If we insert the text “x” in cell C4 of Figure 1, then the value in cell H12 would change to “ ******* “.
Large Outliers
The values in range F11:H22 of Figure 2 are the values (x – median) / mad of the elements x in the three data sets. E.g. The value of the first element in data set X is 19, as shown in cell A3 of Figure 1. For this value, (x – median) / mad = (19 – 29) / 12 = -.83333, as shown in cell F11 of Figure 2. This value is calculated by =(A3-F6)/F7.
We also see from row 8 of Figure 2 that dataset X has 1 potential outlier, dataset Y has 4 potential outliers, and dataset Z has 3 potential outliers. The asterisks in column I help identify where these potential outliers are in the original data. For example, cell I14 contains an asterisk, which indicates that element #4 in one or more of the three datasets is an outlier.
In fact, element #4 in dataset Y (corresponding to cell B6 in Figure 1 whose value is 150) is a potential outlier since 11.5 ≥ 2.5. Here, 11.5 is the value in cell G14 and 2.5 is the value specified in the Outlier Limit field in Figure 2 of Descriptive Statistics and Normality Tool and repeated in cell F3 of Figure 2. Element #4 in dataset Z (corresponding to cell C6 in Figure 1 whose value is 1o2) is also potential outlier since 7.227273 ≥ 2.5.
Small Outliers
Values in F11:H22 of Figure 2 that are less than or equal to -2.5 (the negative of the Outlier Limit) also flag potential outliers. E.g. -10, element #9 in dataset Z (cell C11 of Figure 1), is also a potential outlier since the value in Figure 2 for element #9 of dataset Z is -2.95455 (cell H19), which is less than -2.5.
Details
Representative formulas from Figure 2 are shown in Figure 3.
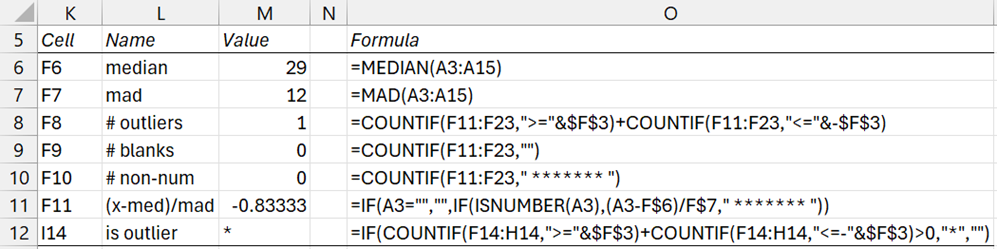
Figure 3 – Outliers and Missing Data details
If you change any of the values in Figure 1 (including changing a numeric value to a non-numeric value or vice versa), the values output in Figure 2 will change accordingly. You can also change the Outlier Limit value in cell F3 and whether an asterisk appears in column I will change accordingly.
If you add additional elements to the data sets in Figure 1, these will not be considered.
See Identifying Outliers and Missing Data for more information about this data analysis tool.