On this web page, we describe Real Statistics support for Markov hitting probabilities and hit times reviewed in Hitting Probabilities.
Worksheet Functions
Starting with Rel 9.9, the Real Statistics Resource Pack provides the following worksheet functions. Here, Rp is the k × k transition matrix P for states S = {1, 2, …, k}, start is any state i in S, and Ra is a column array whose elements comprise a subset A of S. Ra can also take an integer value j between 1 and k (in this case, A = {j}). These functions are based on m simulations of length n such that x0 = start (see Markov Chain Real Statistics Support).
MarkovSimHit (Rp, start, Ra, n, m): returns a 2 × 1 array. The first entry is the fraction of the m simulations that hit A (i.e. for which xj belongs to A for some j ≤ n). The second entry is the average of min {h: xh ∈ A} restricted to the simulations that hit A.
MarkovSimHitFreq (Rp, start, Ra, n, m): returns an array with two columns. The first two entries in column 2 are the same as those output by MarkovSimHit. The remaining entries in column 2 estimate the probability of hitting A in 1 to n steps based on the m simulations (only entries with non-zero probability are listed). Column 1 contains labels for the corresponding entries in column 2.
Examples
Example 1
For the Markov chain of Example 1 of Hitting Probabilities, we obtain an estimate of h12 by using 1,000 simulations of length 100 starting from state 1. For each simulation, we assume that state 2 is going to be hit, then it will be hit within 100 steps.
We use the formula =MarkovSimHit(B2:E5,1,2,100,1000), whose output is displayed in range H2:H3. The estimate of h12 is .365, which is pretty close to the value of 3/8 = .375 obtained for Example 1 of Hitting Probabilities. The value .365 means that 1000 × .365 = 365 of the simulations hit state 2 starting from state 1.
Since h12 ≠ 1, k12 = ∞. Instead, the simulation outputs the average number of steps to hit state 2 restricted to the 365 simulations that actually hit state 2 within 100 steps. Cell H3 shows that this number is 1.611.
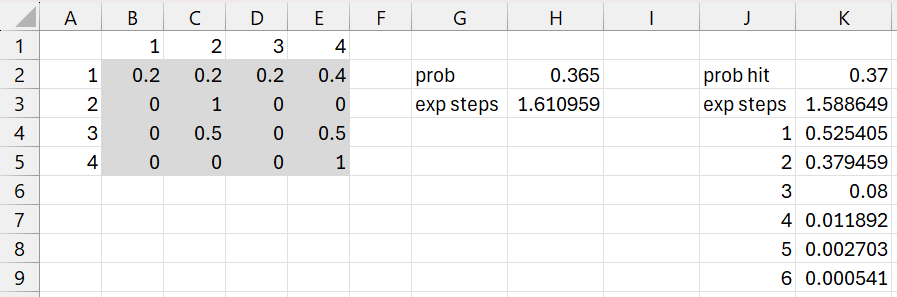
Figure 1 – Simulating the hitting probability and distribution
We can also use the formula =MarkovSimHitFreq(B2:E5,1,2,100,1000) to get more details about the distribution of the number of steps required to hit state 2 starting from state 1. The output is shown in range J2:K9 of Figure 1. For this simulation, 37% (cell K2) of the 1,000 simulations hit state 2. Of the 370 simulations that hit state 2, 52.5% (cell K4) did so in 1 step, 37.9% in 2 steps, etc. None took more than 6 steps (though this may vary for other simulations). Note that =SUM(K4:K9) returns the value 1, and =SUMPRODUCT(J4:J9,K4:K9) returns 1.589, the value in cell K4, the average number of steps required to hit state 2 when state 2 is hit.
Example 2
Repeat Example 1 for the Markov chain from Example 2 of Hitting Probabilities.
The output from =MarkovSimHit(B2:D4,1,3,200,10000) is displayed in range G2:G3, and the output from =MarkovSimHitFreq(B2:D4,1,3,200,10000) is displayed in range I2:J19.
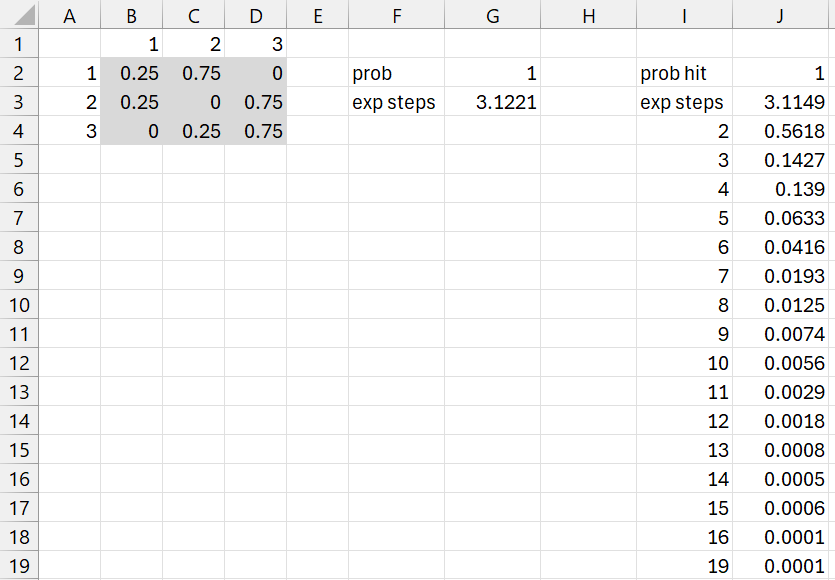
Figure 2 – Simulation for Example 2
Note that the simulation matches the hitting probability h1A = 1, calculated in Hitting Probabilities. Since h1A = 1, the value in G3 is an estimate of k13, which is 3.1111, as calculated in Hitting Probabilities. The estimates of 3.1221 (cell G3) and 3.1149 (cell J3) are pretty close.
Example 3
Repeat Example 1 for the Markov chain from Example 3 of Hitting Probabilities.
This time, we use the array worksheet formulas =MarkovSimHit(B2:E5,2,G2:G3,10,10000) and =MarkovSimHitFreq(B2:E5,2,G2:G3,10,10000). The estimates for h2A are close to the .3 value calculated in Hitting Probabilities. We also observe that if the Markov chain is going to hit A starting from state 2, it will do so in one step.
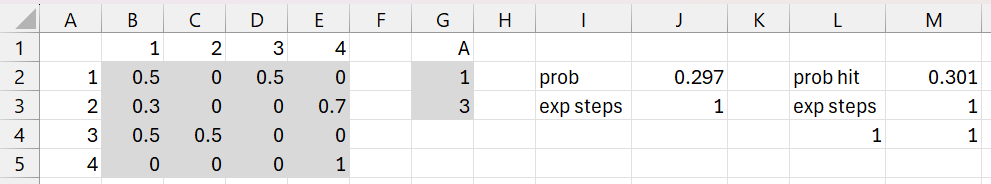
Figure 3 – Simulation for Example 3
Examples Workbook
Click here to download the Excel workbook with the examples described on this webpage.
Links
References
Aldridge, M. (2021) Hitting times. Introduction to Markov Processes
https://mpaldridge.github.io/math2750/S08-hitting-times.html
Norris, J. (2004) Discrete-time Markov chains. Cambridge University Press
https://www.statslab.cam.ac.uk/~jrn10//Markov/
Sargent, T. J., Stachurski, J. (2025) Markov chains: Basic concepts. First course in quantitative economics with Python
https://intro.quantecon.org/markov_chains_I.html
Tolver, A. (2016) Introduction to Markov chains
https://www.math.ku.dk/bibliotek/arkivet/noter/stoknoter.pdf
Chao, J. C. (2020) Markov chains
http://econweb.umd.edu/~chao/Teaching/Econ721/Econ721_Lecture_on_Markov_Chains.pdf