Probability of a sequence of observations
We now investigate how to determine the probability that a given sequence of observations occurs for an HMM.
Naive approach
Let z = z1, …, zn be a sequence of observations. We don’t know the corresponding Markov chain states x = x1, …, xn, but in any case, we can express this probability as a sum over all possible sequences x.
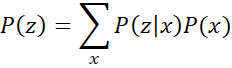
where
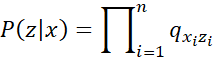
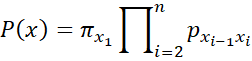
Since there are kn possible sequences x, where k = # of states, this results in an enormous number of calculations (and requires exponential time).
Forward approach
We now describe an approach that succeeds in polynomial time. Let

for any state s, where

Thus, P(z) = P(z1:n) = the sum of the αn(s) over all states s.
Fortunately, we can calculate the αi(s) iteratively in time proportional to nk2, as follows:
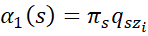

for i = 2, …, n.
Backward approach
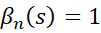
We now describe another approach that succeeds in polynomial time. Let

Thus
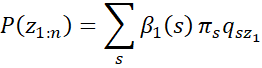
We can calculate βi(s) iteratively, in time proportional to nk2 as follows

Example
Example 1: What is the probability that the observed sequence from the HMM in Example 1 of HMM Simulation is
z = (2, 1, 3, 2)
Figure 1 shows that this probability is 1.5485%.
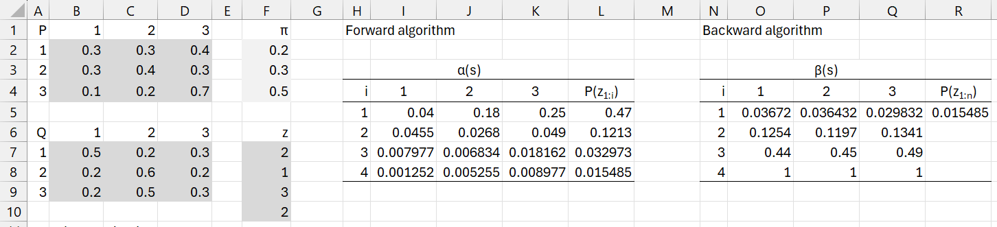
Figure 1 – Probability of observation sequence
Forward algorithm
We obtain this result using the Forward algorithm by placing the formula
=INDEX($F2:$F4,I4)*INDEX($B$7:$D$9,I$4,$F7)
in cell I5, highlighting range I5:K5, and pressing Ctrl-R. Next, we insert the formula
=INDEX($B$7:$D$9,I$4,$F8)*MMULT($I5:$K5,B$2:B$4)
in cell I6, and highlight range I6:K8, and press Ctrl-R and Ctrl-D.
Alternatively, we can insert the formula
=TRANSPOSE(F2:F4*INDEX(B7:D9,,F7))
in range I5:K5, and then place the formula
=TRANSPOSE(INDEX($B$7:$D$9,,F8))*MMULT(I23:K23,$B$2:$D$4)
in range I6:K6, highlight range I6:I8, and then press Ctrl-D.
In either case, we place the formula =SUM(I5:K5) in cell L5, highlight range L5:L8, and press Ctrl-D to obtain the sums.
Backward algorithm
We can use the Backward algorithm by placing 1 in cells O8, P8, and Q8, and the formula
=MMULT($O6:$Q6*INDEX($B$2:$D$4,O$4,),INDEX($B$7:$D$9,,$F8))
in cell O5. We then highlight range O5:Q7, and press Ctrl-R and Ctrl-D. Finally, we insert the formula =MMULT(O5:Q5,F2:F4*INDEX(B7:D9,,F7)) in cell R5.
Alternatively, we can obtain the results in range O5:Q7 by placing the formula
=TRANSPOSE(MMULT($O24:$Q24*$B$2:$D$4,INDEX($B$7:$D$9,,$F8)))
in cell O5, highlighting O5:Q7 and pressing Ctrl-D.
Worksheet Functions
The Real Statistics Resource Pack provides the following functions where Rp is a k × k transition matrix, Rd is a k × 1 initial distribution array, Rq is a k × m emission matrix, and Ro is an n × 1 array of observations.
HMM_Forward (Rp, Rd, Rq, n, total): returns an n × k array containing the αi(s) values if total = FALSE (default). If total = TRUE, then a column is appended to the output containing the P(z1:i) values.
HMM_Backward (Rp, Rd, Rq, n, total): returns an n × k array containing the βi(s) values if total = FALSE (default). If total = TRUE, then a column is appended to the output containing the P(z1:n) value in the first row and blanks elsewhere.
For Example 1, the array formula =HMM_Forward(B2:D4,F2:F4,B7:D9,F7:F10) produces the results shown in range I5:L8 of Figure 1. Similarly, the array formula =HMM_Backward(B2:D4,F2:F4,B7:D9,F7:F10) produces the results shown in range O5:R8.
Links
Examples Workbook
Click here to download the Excel workbook with the examples described on this webpage.
References
Wikipedia (2026) Hidden Markov model
https://en.wikipedia.org/wiki/Hidden_Markov_model
Jurafsky, D., Martin, J. H. (2026) Hidden Markov models
https://web.stanford.edu/~jurafsky/slp3/A.pdf
Frazzoli, E. (2010) Intro to Hidden Markov Models
https://ocw.mit.edu/courses/16-410-principles-of-autonomy-and-decision-making-fall-2010/55e488318190f148c4ed211e2c96bada_MIT16_410F10_lec20.pdf