Objective
In Statistical Power and Sample Size we show how to estimate the power of a statistical test and the related problem of determining the minimum sample size for a test to achieve a desired power. There we restricted ourselves to a one-sample z-test. We now address the two-sample z-test case.
Calculating Power
The test statistic for the two-sample z-test, as described in Comparing Two Means when Variances are Known, is
The formula for the power of a one-tailed two-sample test is the same as for the one-sample test, namely
1 – β = Φ(δ – zcrit)
where Φ(z) is the cdf of the standard normal distribution at z, but this time
zcrit = NORM.S.INV(1 – α)
The power of the two-tailed test is
where δ is as above and
zcrit = NORM.S.INV(1 – α/2)
Example
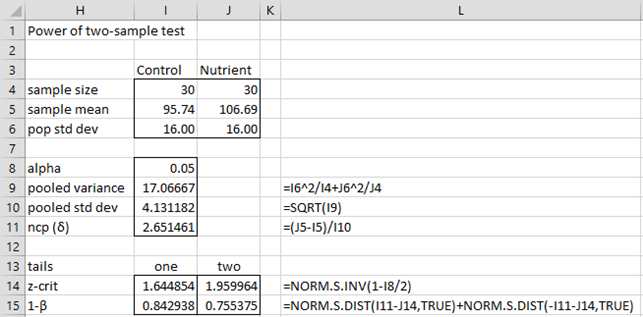
Example 1: Calculate the power of the test in Example 1 of Comparing two Means when Variances are Known.
We calculate the power of both the one-tailed and two-tailed tests in Figure 1. The formulas shown in column L are for the two-tailed test. The power of the one-tailed test is 84.3% and the power of the two-tailed test is 75.5%.
Figure 1 – Power of two-sample test
Calculating Difference in Means
This time, we use the following formula for the noncentrality parameter
δ = zcrit – zβ
where zβ = NORM.S.INV(β), and zcrit = NORM.S.INV(1–α) for the one-tailed test and zcrit = NORM.S.INV(1–α/2) for the two-tailed test. Thus
Example
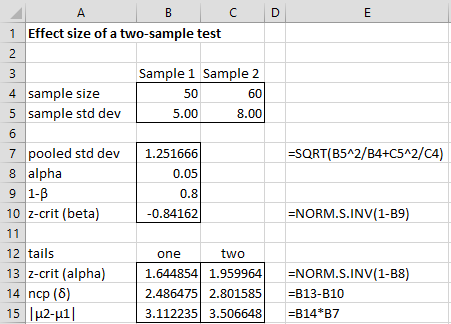
Example 2: Find the smallest value of |μ2 – μ1| that can be detected with power 80% from a two-sample test of the means based on samples of sizes 50 and 60 and population standard deviations of 5 and 8, respectively.
We see from Figure 2 that the difference between population means that can be detected is 3.11 for a one-tailed test and 3.51 for a two-tailed test. Note that the formulas shown in column E of Figure 2 are for the one-tailed test.
Figure 2 – Difference of means for two-sample test
Calculating Sample Size
Assuming ratio of the sample sizes for the two samples in a two sample z-test is r = n2/n1, then, the size of the first sample is
If instead n2 is fixed then we can compute n1 as follows:
Example
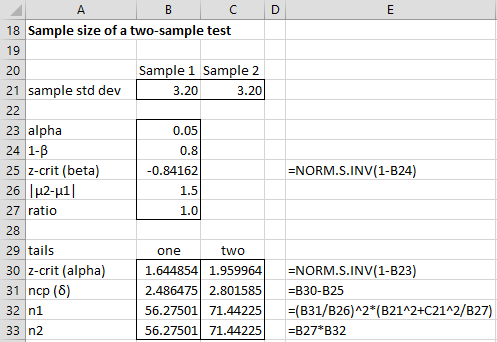
Example 3: What is the minimum sample size needed to obtain power of at least 80% for a two sample test to detect a difference between the population means of 1.5 where both populations have a standard deviation of 3.2 (assuming that both samples have the same size)?
We see from Figure 3 that the size required for each sample for a one-tailed test is 57 and 72 for a two-tailed test. Note that the formulas shown in column E in Figure 3 are for the one-tailed test.
Figure 3 – Sample size required for two-sample test
Examples Workbook
Click here to download the Excel workbook with the examples described on this webpage.
References
Faul, F., Erdfelder, E., Buchner, A., & Lang, A. G. (2009). Statistical power analyses using G*Power 3.1: Tests for correlation and regression analyses. Behavior Research Methods, 41, 1149-1160.
http://link.springer.com/article/10.3758/BRM.41.4.1149
STAT (2015) Power and sample size reference manual, release 13
http://www.stata.com/manuals13/pss.pdf


