Basic Concepts
In analyses where the possible outcomes are “Conservative, Labour or Liberal-Democrat” or “Red, Blue, Green” there is no apparent order to the possible outcomes. When the outcomes are “Small, Medium, Large” or “City, State, Country” or “Strongly Disagree, Disagree, Agree, Strongly Agree” there is an intrinsic order. On this webpage, we address the case of multinomial logistic regression where the outcomes for the dependent variable can be ordered, i.e. ordinal regression.
Suppose the possible outcomes for the dependent variable are 1, …, r. Let pih = P(yi ≤ h), i.e. the cumulative probabilities. Thus 0 = pi0 < pi1 ⋯ < pir = 1 (thereby capturing the order of the outcomes), where pi0 = 0 for notational convenience. Then for h = 1, …, r
P(yi = h) = P(yi ≤ h) – P(yi ≤ h–1) = pih – pih-1
This model can be viewed as r binary models with events y ≤ h vs. h < y. The logit models for h = 1, …, r–1 are therefore
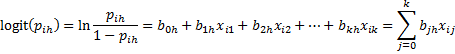
where for convenience we set xi0 = 1. Thus
![]()
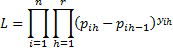
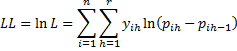
The likelihood and log-likelihood statistics are as follows:
Example 1: A study was conducted based on a sample of 420 people to determine how satisfied people are with their mobile device based on a Likert scale (1 to 4 with 1 = not very satisfied and 4 = very satisfied). People in the sample were characterized by gender (female = 1 and male = 0) and age (0 = under 18, 1 = 18-24, 2 = 25-30, 3 = 31-40, 4 = over 40). Create an ordered logistic regression for this study based on the data in Figure 1.

Figure 1 – Data for Example 1
We now present different approaches for creating the ordinal logistic regression models, especially for finding the coefficients. We also compare the results obtained with those obtained using a multinomial logistics regression model.
Using binary logistic regression models
We begin by developing three cumulative binary regression models as shown in Figure 2.
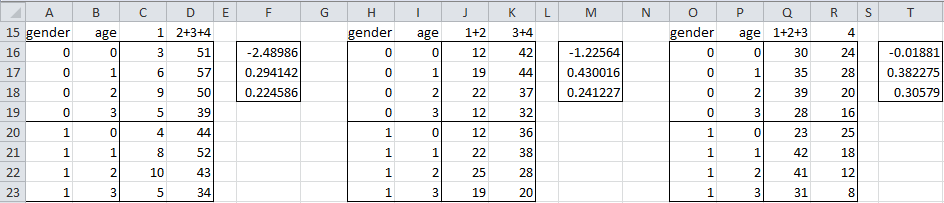
Figure 2 – Cumulative binary logistic regression models
We now find the coefficients for each of these models using the Logistic Regression data analysis tool or the LogitCoeff function. E.g. the coefficients for the 1 vs. 2+3+4 model in range F16:F18 can be calculated by the array formula =LogitCoeff(A16:D23).
We now build the ordinal logistic regression model as shown in Figure 3 and 4
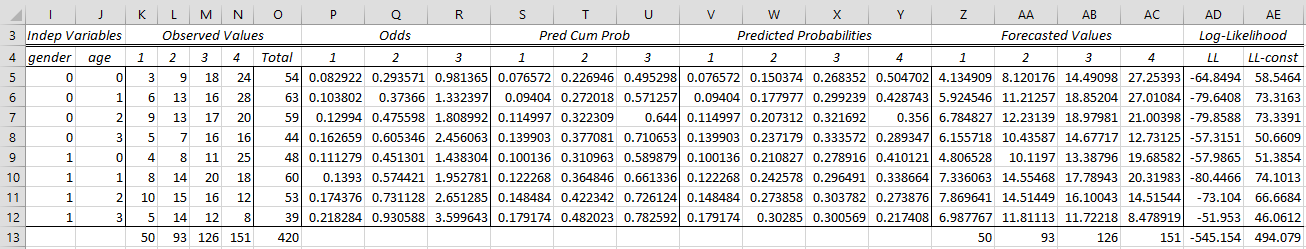
Figure 3 – Ordinal logistic regression model (part 1)
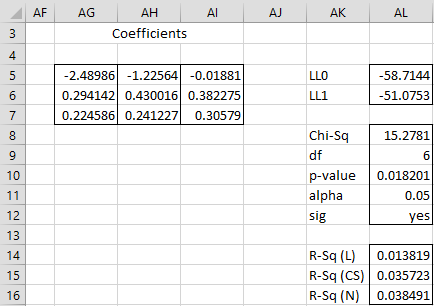
Figure 4 – Ordinal logistic regression model (part 2)
Representative formulas used in Figures 3 and 4 are shown in Figure 5.
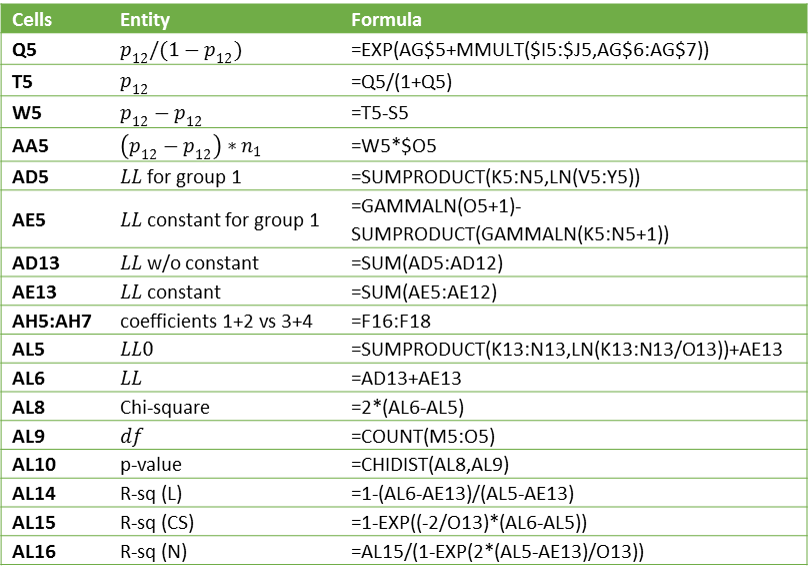
Figure 5 – Representative formulas from Figure 3 and 4
Note: The formula for cell AL9 in Figure 5 should be =COUNT(AG6:AI7).
General model using Solver
As we did for multinomial logistic regression models we can improve on the model we created above by using Solver. As before, our objective is to find the coefficients (i.e. range AG5:AI7 in Figure 4) that maximize LL (i.e. cell AD13 in Figure 3 or AL6 in Figure 4). The result is shown in Figure 6.
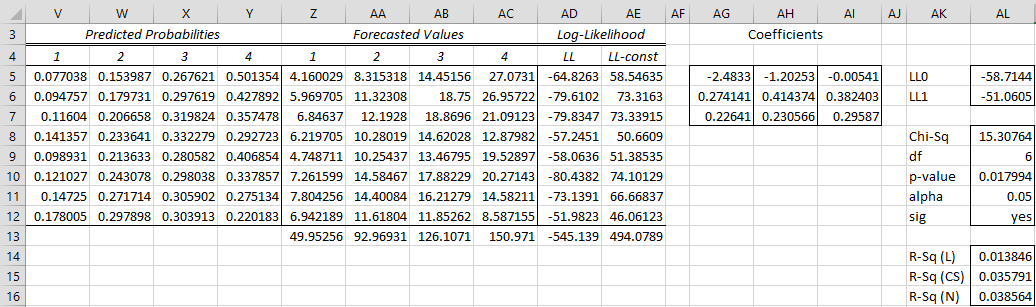
Figure 6 – Revised ordinal logistic regression model
We see that the new value of LL is -50.5323, a slight improvement over the previously calculated value of -51.0753.
Observation: We can’t initialize the coefficient values with zeros since this would result in taking the log of zero. We, therefore, choose to initialize the coefficients with the values from the three binary models.
Real Statistics Function: The Real Statistics Resource Pack provides the following array function
OLogitPredX(R0, R1) – outputs a 1 × r row vector which lists the probabilities of outcomes 1, …, r (in that order), where r = 1 + the number of columns in R1, for the values of the independent variables contained in the range R0 (in the form of either a row or column vector) based on the ordinal logistic regression coefficients contained in R1. Note that if R0 is a 1 × k row vector or k × 1 column vector, then R1 is a (k+1) × (r – 1) range.
Figure 7 shows the forecast for a female (gender = 1) 25-30 (age = 2).

Figure 7 – Forecasting using the model
Here the values in range C19:F19 are calculated using the formula =OLogitPredC(A19:B19, AG5:AI7) where the coefficients in range AG5:AI7 are shown in Figure 6.
The results show that the probability that a 25-30 year-old woman will be very unsatisfied is 15.1%, unsatisfied 25.7%, satisfied 31.1% and very satisfied 28.0%. These values agree with the data shown in range V11:Y11 of Figure 6.
We can also use the OLogitPredX function for forecasts corresponding to data not in our sample. E.g. for women in age group 2.5 (presumably halfway between 2 and 3, say aged approximately 21-28) we can use the formula =OLogitPredX(A20:B20, AG5:AI7) to obtain the results shown in range C20:F20 of Figure 7.
Proportional odds model (using Solver)
A common approach used to create ordinal logistic regression models is to assume that the binary logistic regression models corresponding to the cumulative probabilities have the same slopes, i.e. bj1 = bj2 = ⋯ = bjr-1 for all j ≠ 0. This is the proportional odds assumption.
E.g. for Example 1, we can create a chart of the observed y values for each of the three binary logistic regression models (after sorting them) as shown in Figure 8.

Figure 8 – Testing the proportional odds assumption
As you can see these graphs are roughly parallel, indicating that the proportional odds assumption holds. While this assumption doesn’t always hold, this type of model is commonly used since it reduces the number of coefficients needed. In fact, defining bj = bj1 = bj2 = ⋯ = bjr-1 for all j ≠ 0 and defining ah = b0h for all h, we only require the full set of intercept coefficients but only one set of slope coefficients.
Figure 9 shows this model.
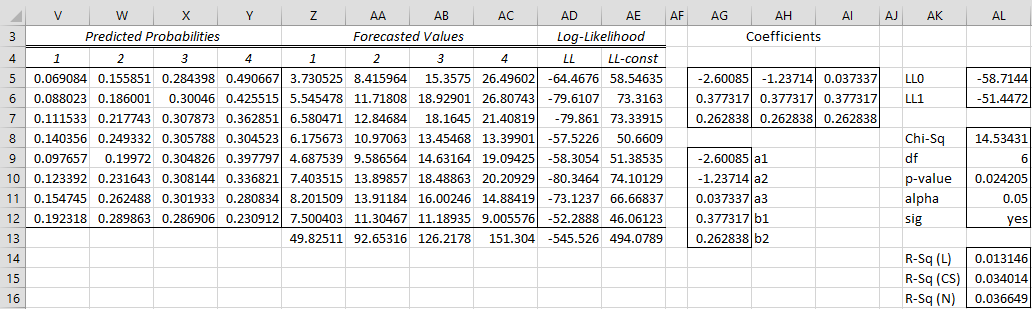
Figure 9 – Proportional odds model
Solver is used to maximize the value of LL (i.e. maximize cell AD13 while changing the values of AG9:AG13). We see that the value of LL is -50.9083, which is better than the value obtained from the first model (binary only) but not as good as the second model (binary + Solver). In any case, the results obtained from all three models are similar.
Observation: As in the previous model we can’t initialize the coefficient values with zeros since this would result in taking the log of zero. We, therefore, choose to initialize the coefficients with the intercepts from the three binary models and the slope coefficients from the first binary model.
Using multinomial logistic regression
We could of course ignore the order in Example 1 and simply use a multinomial logistic regression model. The results are shown in Figure 10.

Figure 10 – Multinomial logistic regression model
Here we are using the following functions
=MLogitCoeff(A25:F33,3,TRUE,TRUE)
=MLogitTest(A26:F33,3,TRUE)
to calculate the coefficients, LL0, LL and other values. We also use
=MLogitPredC(I33:J33,$J$26:$L$28)
to obtain the forecasted values. The values are similar to those we have seen earlier, but in general, when the independent variables are ordered it is best to use an ordinal logistic regression model.
Examples Workbook
Click here to download the Excel workbook with the examples described on this webpage.
References
Agresti, A. (2013) Modeling Ordinal Categorical Data tutorial
http://statmath.wu.ac.at/research/talks/resources/slidesagresti_ordinal.pdf
Hi Charles,
I am desperately trying to test if two groups, horses living in stalls vs. pastures (coded as pasture=0 and stall=1) are different from each other in the progression of the shape of part of their tooth, which is already recorded to have a set shape-to-shape progression in relation to their age (continuous variable, but the AP Stats teacher recommended switching it to an interval ie. 5-9 yrs, 10-14 yrs, etc.). To better explain, as a horse ages from 5-20 years, the shape of that part of their tooth shifts from round->rounded triangle->triangle->ovular->biangular and my research study is meant to see whether the conditions a horse lives in (which affects what they eat, and how often which increases or decreases chewing->quicker or slower tooth shape progression) has an effect on the shape progression. So what test should I use, mind you my sample size is small considering I do not have access to 100s of horses, so am I screwed? I also need to test the same independent variables on a continuous variable so I would like to know what test to use for that as well. Your help is incredibly appreciated and I have heavily referenced your site and utilized your package but I have decided I have spent enough hours problem solving and that I should ask for help.
Hello Cate,
I want to make sure that I understand what you are trying to study. From your description, I understand that you have the following factors:
Location: stall vs pasture
Age: 5-9, 10-14. 15-19, 20 or higher
Tooth Shape: round->rounded triangle->triangle->ovular->biangular
There is an order to the Age values and I believe there is an order to the Tooth Shape values (as indicated above)
Some questions for you:
1. It seems that the dependent variable here is the Tooth Shape and the independent variables are the Location and Age. If so, you hope to predict the tooth shape base on Location and Age. Is this correct or are looking to test something else?
2. How big is your sample of horses who eat in the stall?
3. How big is your sample of horses who eat on the pasture?
4. What are the ages of the horses in each group?
Charles
Great post Charles.
It’s easy to understand how the multinomial form of the slope coefficient is calculated using a series of logit regressions, but is there information on how the slope coefficient b0=b1=… is calculated under the hood when each logistic regression shares the slope?
My guess would be: you just run a single logit regression for all the comparisons, but use dummy variables indicating which comparison is being done, e.g. a dummy for “highly likely > likely”, a dummy for “likely > neutral”, etc.– is that correct?
Hello Daniel,
This is explained at https://real-statistics.com/ordinal-regression/proportional-odds-model/
Charles
Hi Charles, Fabulous post! I could really use your help to determine if this regression approach is the right one for me, and if so, how do I set it up. In response to a survey about a new product, I received 2229 responses (yay). The most critical questions in the survey are Usage Intent, and Importance of 17 different features. All questions use a 5-point Likert scale. Intention to use this product is measured as follows:
5 Definitely would use
4 Probably would use
3 Might or might not use
2 Probably not use
1 Definitely not use
Importance (of feature) in decision to use this product is measured as follows:
5 Extremely important
4 Very important
3 Neutral
2 Not very important
1 Not at all important
I also have 10 age brackets ranging from <25 to 65+
My objectives are to:
1) identify those variables most highly correlated with usage intent and are they significant
2) determine if there is any multicollinearity in my data
3) understand which features are drivers of usage intent
4) gauge how 1) and 3) vary by age group (smallest sample sizes are the youngest age cohorts, <25 n=26, and 25-29 n= 58, so would most likely combine these groups).
I have already tried several approaches in Excel: Regression: UI to all independent variables; Correl: UI to each independent variable separately, UI to all independent variables; VIF, ANOVA, and Spearman (only on one variable but got 1.000 result so did not pursue it. Pearson looked good but the highest coefficient I got was 0.2855!. I'm not sure that any of these analyses make sense given the type of data I have, and am suffering a little from analysis-paralysis. Any guidance would be appreciated.
I have access to Excel only, which would be the best statistical techniques to achieve my objectives?
Thanks a ton for reading this far!!
Tracy
Hi Tracy,
If I understand correctly, you are using the data from your survey to build an ordinal regression model whose dependent variable is Usage Intent.
1) Once you build the model, you can determine which independent variable make a significant contribution by looking at the p-value for that variable, as shown in Figure 2 of https://real-statistics.com/ordinal-regression/real-statistics-ordinal-regression-support/
2) You can check for collinearity as described at
https://real-statistics.com/multiple-regression/collinearity/
Note that although this webpage refers to linear regression and not ordinal regression, the process is the same since collinearity does not involve the dependent variable, only the independent variables.
3) This should result from the results from item #1 above. Also note that if you have a lot of independent variables, you may want to consider using Factor Analysis to find the underlying (latent) factors. See https://real-statistics.com/multivariate-statistics/factor-analysis/
4) If you include Age (or age intervals) as one of the independent variables in your analysis, then for each other independent variable x that you want to study with respect to age, you should also add an interaction variable x * Age (i.e. x times age), so that you can perform the analyses that you have in mind. See the following webpage for details: https://real-statistics.com/interaction/
Charles
Awesome!!! Thank you very much. I have completed several factor analyses and have a couple of questions about the output.
Your wonderful tool generates quite a few different solutions. I have focused on the Factor Matrix (rotated Varimax) is that the right one/is it OK? Hope so!
In that solution there are a few things I don’t understand. To the right of the table are 2 columns titled Commun (Common?) and Specific – what do those numbers mean numbers?
At the bottom of each factor is a “Total”, what are those numbers and how should I interpret them?
I have 17 independent variables and have several analyses changing the number of factors 3, 4, 5 are two few and do not make much sense. 12 is probably the best “fit” but the numbers at the bottom of the table seem quite a bit lower. Is 12 too many?
Cheers
Tracy
Apologies Charles, I just found Communalities, so no need to explain that one. I do have an additional question about VIF and Tolerance. Is there a specific tab and function in your Real Stats Toolpak to calculate these (like the output shown in your Collinearity example) or do I need to calculate it using the R-square formulae?
Thanks so much
Tracy
Tracy,
1. These can be calculated using the Tolerance and VIF worksheet functions. You use them just like any Excel worksheet function. See the following for details:
https://real-statistics.com/multiple-regression/collinearity/
2. The VIF value is also shown on the output from the Regression data analysis tool. For example, see Figure 3 in
https://real-statistics.com/multiple-regression/multiple-regression-analysis/real-statistics-capabilities-for-multiple-regression/
Charles
Hi Charles, Thank you for your very clear explanations! Your ordinal logistic regression example dichotomizes age. Can age be a continuous dependent variable in this approach? The Real Stats Data Analysis Tool add-in for Excel seems to limit the number of data rows to 25, making inclusion of continuous variables difficult for larger data sets. If I understand your response to a similar question you suggest that summarizing continuous dependent variables does not affect the results, so I assume that we must summarize such data in order to use the Real Stats Data Analysis Tool add-in. Is this correct? I would rather include the raw data without summarizing, but will do so if that is a necessary element of the Analysis Tool.
Hello Bob,
Yes, Age can be considered to be a continuous variable.
The Real Statistics data analysis tool supports a lot more than 25 rows. You don’t need to summarize the data.
Charles
Hi Charles,
I made the cumulative binary logistic models and ended up with some negative predicted probabilities. It’d be great if you could help me figure out what went wrong. Thanks.
Hi Iny,
If you email me your data and results, I will try to figure out what is going wrong. My email address can be found at
Contact Us
Charles
Hi Charles,
thank you very much for this ordinal regression material, its very helpful.
However, I still have a question. I still don’t understand how the v,w,x,y column values can be filled in. I’m wondering what the formula is to get the column to be filled. Maybe you can help me.
thanks again and expect your reply.
Zia
Hello Zia,
I have added an Excel workbook with all the examples on this web page.
You can download the spreadsheets by clicking on the link that is found just above the Reference sectio n.
Charles
Thank you very much for taking the time to help me.
Zia
Hi Charles,
May I know if you have a sample interpretation of results from the ordinal regression like a case study to help users interpret the results they’re getting from the LogitCoeff formula? Thanks a lot!
Hi Eddy,
This is an excellent question. I will add a discussion of this issue to the website shortly, but in the meantime, see
https://stats.idre.ucla.edu/other/mult-pkg/faq/ologit/
Charles
Thank you, Charles. With respect to the coefficients determined with the Real Stats Data Analysis Tool add-in is it correct that the odds ratio can be determined by exponentiation of the coefficient of the independent variable?
Hi Bob,
By odds ratio are you referring to odds ratio as a measure of effect size? If so, I believe that the coefficient is the natural log of the odds ratio. See page 71 of the G*Power reference at https://real-statistics.com/logistic-regression/logistic-regression-sample-size/.
Charles
Hi, this is very helpful. I am wondering, how to do plots/graphs like what you have in Figure 8. Can you help me on that? Thank you very much.
JB,
See https://www.real-statistics.com/excel-environment/excel-charts/ for one line chart and the following webpage for multiple line charts:
https://www.real-statistics.com/excel-environment/excel-charts/line-charts-multiple-series/
Charles
Hi,
Thanks for this informative web page.It is really helpful.
But I have a question to ask.
While developing models for binary logistic regression as in figure-2 ,why didn’t we included models (2 and 1+3+4) or (3 and 1+2+4) so on?
I really didn’t understand why we developed only three models…
Thanks in advance.
Harun,
If 1 < 2 < 3 < 4, then 1 vs 2+3+4 and 2 vs 3+4 and 3 vs 4 captures the ordering. E.g. 3 vs 1+2+4 doesn't capture the order since 1, 2 < 3 but 3 < 4. Charles
Hallo, I am struggling with the LogitCoeff function at the Cumulative binary logistic regression models. I installed the add-on successfully. I have two independent variables and an ordinal scale (1 – 6) as dependent variable. I don’t know if it is because I have an ordinal scale that goes to 6 or if it is that I only have 69 participants. Does that play a role? Is my sample size too small?
Hello San-Mari,
Whether the sample size is too small depends on how many independent variables you have, but it is probably sufficient.
If you email an Excel file with your data and any output you got, I will try to figure out what is happening.
Charles
Hi Charles,
I have no SPSS. so i tried to analyze same data with Ordinal Log.Reg in Minitab but i couldn’t find the same coefficients and odds .
Is it my fault or is it normal?
Thanks
If you email me an Excel file with your data and results as well as the output you got from Minitab, I will try to look into why the results are different.
Charles
Thanks a lot for all the help!
I am trying to perform a multinomial logistic regression analysis with 2 independent variables and one ordinal dependent variable (1,2,3,4,5). The model from the tool pack gives me the coefficients, but I am receiving value errors for all the values in the R-square and significant tests.
Any ideas?
Thanks!
Hello Blake,
If you send me an Excel file with your data and results, I will try to figure what the problem is.
Charles
I just sent an email. Thanks!
Hey Charles, i got 3 independent events, with 3 probabilities in percentage, and i cannot use ordinal logit regression. Can you help me with some advices? I mean none of your regression from resource pack doesn’t work on my excel 2016. Explain in detail. Thanks.
Sorry Adrian, but I don’t understand your comment. Can you describe your data in a little more detail and what you are trying to accomplish?
Charles
Hello Charles. I’m trying to apply ordinal regresion in football matches. So, there are 3 probabilities Home, Draw, Away. How do i calculate it, in order to work your regression? Thank you for your answer.
Adrian
Still there?
hi Charles
How do we calculate Covariance Matrix of Ordered Logistic Model in excel, i did every thing i could, i even calculated the Hessian matrix but my results defers from other software please help me….
regards
Hello Sohrab,
I don’t know what you mean by the Covariance Matrix of Ordered Logistic Model. Are you referring to the covariance matrix of the data used to build the ordered logistic model? This is described at the following webpage:
https://real-statistics.com/multiple-regression/least-squares-method-multiple-regression/
Charles
Hi Charles
No that wont work…
i need to calculate Standard Errors of the coefficients in Multinomial Ordered logistic model, just like Multinomial logistic model. Thus, the Covariance Matrix of coefficients needed. However, I don’t know how to do it.
Sorry Sohrab, but Real Statistics doesn’t yet provide this capability.
Charles
Dear Charles,
Is there a way to solve ordinal logistic regression on realstat-2010 pac?
Sisay,
At present, RealStats-2010 only provides the OLogitPred function. There is no ordinal regression data analysis tool yet.
Charles
Firstly thank you for you excellent work, which is very helpful.
However, I still got a question. When you try to evaluate the fit of model or the predictive power of the model, cross validation and ROC plot are proven to be useful. So I was wondering the feasibility of those procedures in the Ordinal logistic regression.
thanks again and expect your reply.
Cymamba
Cymamba,
Glad that you are getting value for the Real Statistics website.
I believe that some version of these is feasible, but I have not yet gotten to this capability. I will eventually look into it.
Charles
Hello! Kind of really confused, how did you get the other two coefficients? I did the =LogitCoeff(select whole data) and it just comes up with one coefficient. Really need this for school, hope you could reply soon.
I’m referring to how you got F17 and F18. thanks!
Ronnie,
Range F16:F18 can be calculated by the array formula =LogitCoeff(A16:D23). As described in my previous reply, this is an array formula.
Charles
Ronnie,
LogitCoeff is what Excel calls an array function. You can’t simply press Enter to get all the coefficients. See the following for how to deal with array functions:
Array Functions and Formulas
Charles
Hi Charles,
Is there any rule of thumb for sample size when doing ordinal regression?
Hi Ivan,
Here is an article that explains how to calculate the sample size.
http://www.pmean.com/04/OrdinalLogistic.html
I have not read the article and so can’t vouch for its accuracy.
Charles
Hi Charles,
thank you for the link. This is actually the formula for calculating sample size when comparing two treatments but I was wondering if there’s an alternative when you have only one group and ordinal variable with five categories.
Ivan,
Are you saying that you have only one independent variable (presumably continuous) and one dependent variable (with 5 ordered categories)?
Charles
Charles,
I am sorry for being unclear. I have one dependent variable (with 5 ordered categories) and ten independent variables (both continuous and dichotomous) but I don’t actually have treatment and control group.
Ivan,
I am sorry, but I don’t have any suggestions regarding the required sample size for ordinal logistic regression. By the way, how big a sample were you planning to have?
Charles
Charles,
I don’t know why I cannot reply to your last comment so I am doing it here. I am planning to have a sample of 300 participants.
Ivan,
I don’t know what sort of statistical power a sample of 300 gives you, but this size of sample is generally quite good.
Charles
Dear Charles,
Can you suggest a book which has all these regression chapters?
Thanks !!!
Rajeeb Shakya
Rajeeb,
I plan to publish a book later this year with this sort of information.
Charles
Dear Charles,
Can you suggest me any other book for the time being? I am really in need of such a book.
Thank you !!
Rajeeb,
There are lots of books. Some looking at particular analyses (regression, anova, manova, etc.), some focused on particular fields of study (biology, psychology, etc.), etc., etc. Which topics are you most interested in?
Charles
Dear Charles,
thank you for all your great work and your generosity for sharing it with the greater public.
One question. Can my independent variables be more than two, and can they be ordinal too? More precisely, I want to see if 5 or 6 independent variables that I found to be statistically significant in the first part of my analysis (associations with chi-squares and t-test for the means) can be still significant when all put together, and, if they are, what is their impact on the probability of the outcome variable (which is ordinal). Now, my question, hence, is if it’s possible to include in this ordinal model those 5-6 variables that are ordinal too (“strongly agree”, “slightly agree”…). I am only asking so because I have only seen binary ordinal regression here.
Thanks dear Charles,
all the best
Michelle
Michelle,
You can use ordinal data for the independent variables provided you can assume that the intervals between the Likert values are equal. E.g. for Likert values 1, 2, 3, 4, 5, this assumption means that the “2”-“1” = “3”-“2” = “4”-“3” = “5”-“4”.
Charles
Hi Charles,
About the degree of freedom in figure 5, you enter here = COUNT(M5:O5).
But I do not understand why this is supposed to be the degree of freedom.
For example, on the page
Finding Multinomial Logistic Regression Coefficients,
df is calculated by =COUNT(I5:J5).
Are they both right?
If so, I don’t understand what’s going on.
MM,
There clearly is an error here. I need to research what the value should be.
Charles
The formula is not correct. I have now corrected the formula on the website.
Thanks for catching this error. I appreciate your help in making the website better.
Charles
Dear Dr. Charles,
Thank you for your kind efforts and sharing your knowledge with the greater public.
I found in the table showing the the formulas for the example in figure 3 & 4 the cell for the second formula from the top should be T5 = Q5/(1+Q5 ) to get the cum. prob of the first observation of the second dep. variable.
Thanks Chris for finding this error. I have now corrected this on the referenced webpage-
I appreciate your help in making the website better and easier to understand.
Charles
Hi Charles,
I stumbled across your blog and it has been a great deal of help! I didn’t think ordinal logistic regression was possible in Excel before discovering your site.
One question, though. In the binary logistic regression part of your blog, you say that the researcher should use the outcome with the larger sample size as the reference variable. I’m assuming that’s the reason you don’t calculate the Odds for outcome ‘4’.
My question is in your sample Excel sheet, the Predicted Probabilities for outcome ‘4’ is calculated as (1-Pred Cum Prob of outcome ‘3’). I’ve had to do some manipulation to your Excel worksheet labeled OLogit1 as I have 5 outcomes instead of 4, and the third outcome has the largest sample size. How would you go about readjusting the predicted probabilities for such an issue? I’m trying to figure out how to calculate the predicted probabilities for my outcome ‘3’.
Thanks!
M
Maurice,
There is nothing special about the number of outcomes. The approach for 5 outcomes is pretty much the same as for 4 outcomes.
Charles
I see. Thanks for the response!
I suppose my question is why is the formula for the predicted probabilities for outcome 4 (in cell Y5) “1-outcome 3”? Cells V5:X5 have different formulas, so that’s where I’m getting a bit hung up.
Thanks for sharing such great content by the way!
Maurice,
The value in cell U5 is the cumulative probability for categories 1, 2 and 3. Since there are only 4 categories, the cumulative probability for categories 1, 2, 3 and 4 is 1. This means that the probability for category 4 is 1 – U5.
Charles
Dr good evening, excuse me I don’t understand why when I am Using binary logistic regression models, I have results as
p-Pred Suc-Pred Fail-Pred LL % Correct HL Stat Coeff
All with #!valor¡
Thank you
Gerardo,
It is likely that the binary logistic regression model is not a fit for your data. If you send me an Excel file with your data, I will try to figure out what is happening.
Charles
Hi again Charles,
I had another questions about the significance of the independent variables from the results. I noticed there are no p-values for each independent variables. There is only one p-value. Does this value show the significance of all the variables? Is there a way I can see from the results the significance of each independent variable? i.e, a p-value for each independent variables?
Thank you
Matt
Matt,
The one p-value measures the difference between the given ordinal logistic regression model and the null model, which is not a particularly illuminating statistic.
I have not yet implemented the calculation of standard errors for each model coefficient. From that a p-value per coefficient can be calculated.
Charles
Thank you for your help Charles.
You might have already answered a similar question but I’m not familiar with logistic regression so I was hoping for your advice. I am looking to predict a clients loan repayment performance based on his history and characteristics. Considering I have one dependent variable which is the loan repayment performance of a client and around 20 independent variables including clients characteristics that are both categorical, binary and continuous. Since I would want to predict several outcomes of a clients such as 1=No problem, 2=fairly late repayment, 3=very late repayment, 4=default. Would this work? Do you think that the ordinal regression model would be suitable in this case?
Thank you,
Matt
Matt,
I assume that you view 1, 2, 3, 4 as ordered choices. In this case ordinal regression would be a reasonable choice.
Charles
Thank you Charles! I had another question. I was trying to follow your method above but I could not understand how you got to the ordinal logistic regression model in figure 3. Did you use the real statistics tool to get it? Or did you do it manually? I got confused when trying to understand the formulas in figure 5.
Never mind, I found your excel spreadsheet.
Thanks
Thanks Charles,
I was doing the ordered logistic regression model using the excel spreadsheet on your website and was following all of the formulas using exactly the same data. The thing is for the improved Ordered logistic model using solver I was not getting the same results for LL and the coefficients you got after using solver. Maybe I’m inputting the data wrongly on solver? I’m not sure what the problem is.
Please help
Matt,
It took me quite a long time to find the problem, but I found that there is a mistake in cell L12 of the example. For some unknown reason the contents of the cell changed from =D12 to 11. This made all the calculation wrong. Shortly I will correct this on the website and in examples workbook. There is no problem in the Real Statistics function itself.
Thanks very much for catching this error.
Charles
hi, charles
your resource is a great help
(they say that when you are truly knowledgeable you can put them in simple terms)
however i am curious as to how to find confidence intervals for each ordinal value (as in elections)
…also a question i would think will help all those reading the site and want a complete answer .What does it change when you have categories that do not signify proximity among values in either the dependent or the independent variables.
I am not sure I understand your first question. Are you looking for a confidence interval for logistic regression similar to that used for linear regression? I don’t understand your second question.
Charles
Thank you! That is very helpful.Using the =LogitCoeff(A16:D23), I obtained -2.48986 but for F 17 & 18 it is quite different. How could I do that?
Yohannes,
If you send me an Excel file with your calculations, I will try to figure out what is happening.
Charles
Thank you again, Charles. I am sorry to bother you personally. The data are those given in Example 1 in this page, your data. I tried to calculate them in Excel (as presented in Fiure 2 above) and I obtained -2.48986 for cell F16, but for cells F17 & 18 it is #NAME?. How can I solve it?
You are amazing!!!
Everything I have learned about logistic regression, I have you to thank. Throughout my dissertation I have used you website as a help guide and now working in an environment where this is regression is predominantly used I always come back here for reference and help. Thank you Charles Zaiontz for creating and mastering this website.
Thank you very much. I am glad that I was able to help you.
Charles
I do have one questions;.
Do you have an example of ordinal logistic regression for raw data as opposed to summarised? I have very large data that has 17 dependent variables and 2 independent variables of which one is categorical and the other is continuous. My aim is to avoid summarising this, as this may affect the results of the continuous variable.
Many thanks,
J.
If the values for the continuous variable are all different, then the summarized data will be exactly the same as the raw data except formatted slightly differently. The results won’t be affected since the summarizing that is done doesn’t combine any data except when all the values for the independent variables are identical. For the current release I have added the Multinomial Logistic Regression data analysis tool. I hope to add the Ordinal Logistic Regression tool some time soon.
Charles
Hi Charles,
This is an example of my data set in summary:
Class Volume 1 2 3 4 Total
0 109 1 1
0 131.9 1 1
0 12 1 1
0 126.9 1 1
1 124.2 1 1
1 125.36 1 1
1 134.2 1 1
1 133.6 1 1
Total 2 2 2 2 8
For some reason MLogitCoeff does not work for this example. I am guessing this is because the row totals all add up to 1 for each individual continuous variable in ‘volume’. Here 1-4 is the code for the dependent variable. Do you have any advise on this?
Sorry, but I don’t understand your data. Which are the independent variables and which is the dependent variables? Most importantly what are the range of values for the dependent variable?
Charles
No problem. Thanks Charles.
Hi Charles,
I am using SPSS to conduct a OLR. I have 1 categorical variable (with 4 items) as independent variable and 1 Likert scale (5 levels) ordinal variable as the dependent variable. My questions are:
1. What are the tests that I need to conduct to satisfy the OLR assumptions?
2. What is the format to write the null hypothesis related to OLR?
3. Is there any standard steps (or template) for summarizing the results of OLR?
Thank you.
Sree
Sorry Sree, but I don’t use SPSS.
Charles
Dear Sir
is it possible that I can take continuous values for independent variables (Xi) and discrete values for dependent variables (Y)? If yes, then how? Moreover in case of yes can we say it “regression” or is it “classification”?
If your independent variables are continuous and the dependent variable is dichotomous then you would typically think of using ordinary logistic regression. If the dependent variable takes a small number of discrete, but unordered values then you would explore using multinomial logistic regression. If the dependent variable takes a small number of discrete ordered values (and you care about the order) then you might use ordinal logistic regression. If the dependent variable takes a large number of ordered discrete values then you might even try using multiple linear regression (pretending that the discrete values are continuous) if the model provides a good fit. Typically these are called “regression”, but they are being used for “classification purposes”.
Charles
Good day Mr. Charles. I am in dire need of your help. I find your article useful, as I want to perform the ordinal logistic regression analysis on some data that I have. However, you are article does not go into full detail about how to get to the results you have displayed. I really need your assistance sir. Perhaps I’m not too technically apt to complete the process but I am writing a paper and I really need your assistance with this. Can you email me at the address I posted to reply to article so that we can dialogue further? Thank you
Kurt,
You can get the details for all the ordinal logistic examples on the referenced webpage by downloading the Excel spreadsheets that I created for these examples. Just go to the webpage .
Charles
OK, thank you sir. I will check it out
The LogitCoeff function doesn’t work for me sir
Thanks a lot Charles
Hi Charles,
It was nice reading your blog, can you explain bit more about how to get Coefficients, since i am not finding that LogitCoeff function in excel. Please help me in calculating this.
Thanks in advance.
This is really a great help to a project I’ve been working on. Do you have an example where you have two or more ordinal variables within the data set?
Erik,
Do you mean two or more ordinal dependent variables?
Charles