Motivation
The usual algorithm that performs multiple linear regression calculates (XTX)-1 where X is the design matrix. Ridge and LASSO regression are used when XTX is not invertible or when it is close to not being invertible (such as when there is multicollinearity or when there are more independent variables than data elements.
Sometimes (XTX)-1 can’t be calculated accurately in Excel because of an overflow error. This can occur when there are a large number of independent variables. In such cases, the results from the Multiple Linear Regression data analysis tool will be strange (e.g. R-square value larger than one or a negative value for SSE).
Example
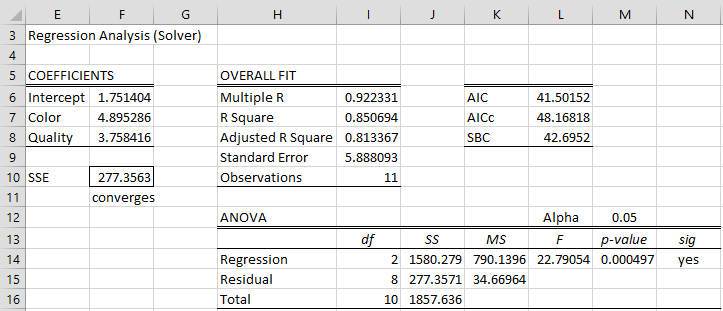
In such cases, you can click on the Use Solver option in the dialog box (see Figure 2 of Real Statistics Capabilities for Multiple Regression) of the Multiple Linear Regression data analysis tool to handle such situations. E.g. for Example 2 of Multiple Regression Analysis in Excel, you would get the output shown in Figure 1.
Figure 1 – Regression using the Solver option
As you can see the coefficients calculated are similar to those shown in Figure 3 of Real Statistics Capabilities for Multiple Regression. For this data, clearly, this approach is unnecessary, but as remarked above, with certain data it can be useful.
Examples Workbook
Click here to download the Excel workbook with the examples described on this webpage.
References
Howell, D. C. (2010) Statistical methods for psychology (7th ed.). Wadsworth, Cengage Learning.
https://labs.la.utexas.edu/gilden/files/2016/05/Statistics-Text.pdf
Microsoft Support (2019) Define and solve a problem using Solver
https://support.microsoft.com/en-us/office/define-and-solve-a-problem-by-using-solver-5d1a388f-079d-43ac-a7eb-f63e45925040
