Data Analysis Tool
Real Statistics Data Analysis Tool: The Real Statistics Kernel Density Estimation Chart data analysis tool can be used to create a chart of the KDE for a set of sample data.
To use this data analysis tool for Example 1 of KDE Example, press Ctrl-m and select Kernel Density Estimation from the list of options (on the Desc tab when using the multipage user interface). Now fill in the dialog box that appears as shown in Figure 1.
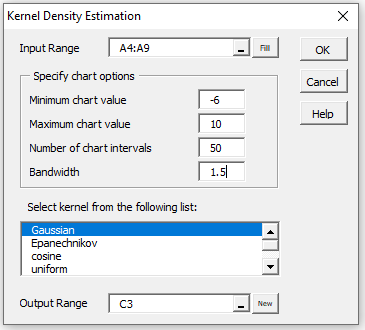
Figure 1 – Kernel Density Estimation dialog box
You can leave the Minimum chart value and/or Maximum chart value fields empty to accept the defaults. If mn and mx are the minimum and maximum values of the data in the Input Range respectively, then the default for Minimum chart value is mn – (mx–mn)/4 and the default for Maximum chart value is mx + (mx–mn)/4.
Upon clicking the OK button on the dialog box in Figure 1, the output shown in Figure 2 is displayed (only the first 12 rows of the output in columns F and G are displayed).
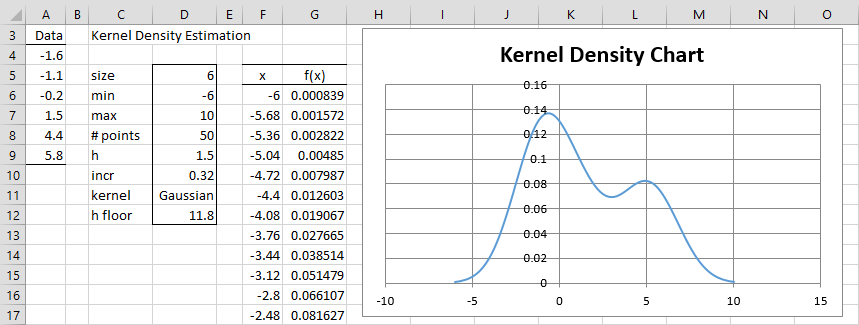
Figure 2 – KDE data analysis tool output
You can change any of the values in cells D6, D7, D8, or D11 (as long as they are legal values). You can also change any of the values in the input range A4:A9 as long as you replace them with numeric values (no blanks or non-numeric values are acceptable), but you can’t lengthen or reduce the size of the input range.
Legal Kernel Values
Legal values for the kernel in cell D11 are shown in Figure 3.
| Kernel name | ktype |
| Gaussian | 1, Gaussian, gaussian, normal |
| Epanechnikov | 2, Epanechnikov, epanechnikov, epan |
| cosine | 3, cosine, cos |
| uniform | 4, uniform, rectangular |
| triangular | 5, triangular, triang |
| biweight | 6, biweight |
| triweight | 7, triweight |
| tricube | 8, tricube |
| logistic | 9, logistic, logit |
| sigmoid | 10, sigmoid |
| Silverman | 11, Silverman, silverman, silver |
| Epan5 | 12, Epan5, epan5 |
Figure 3 – Valid ktype values
As mentioned previously, seven of the kernels require that the domain be restricted to values of |u| ≤ 1. This means that |u| = |(x–xi)/h| ≤ 1 for any xi in the sample (i.e. values in the Input Range) and any x between the Minimum chart value and Maximum chart value. If mn and mx are the minimum and maximum sample values and Mn and Mx are the minimum and maximum chart values, then this is equivalent to stating that
h ≥ h floor = max(mx–Mn, Mx–mn)
Epan5 is similar, except that the domain is restricted to values of |u| ≤ √5.
Observations
For Example 1 of KDE Example, h floor = max(5.8-(-6), 10-(-1.6)) = 11.8, as shown in cell D12 of Figure 2 and calculated by the formula =MAX(MAX(A4:A9)-D6,D7-MIN(A4:A9)).
Thus, for seven of the kernels, you should make sure that the bandwidth (cell D9 of Figure 2) is no smaller than 11.8. Of course, this is not necessary for the Gaussian kernel, which doesn’t require that |u| ≤ 1.
Finally, note that range G6:G56 in Figure 2 contains the Real Statistics array formula =KDE(F6:F56, A4:A9, D9, D11), as described next.
Worksheet Function
Real Statistics Function: The Real Statistics Resource Pack contains the following array function where R1 is a column array of x values and R2 is a column array with sample values.
KDE(R1, R2, h, ktype): returns a column array with f(x) values corresponding to the x values in R1 based on the sample data in R2, the bandwidth h and the kernel specified by ktype (as defined in Figure 3).
Examples Workbook
Click here to download the Excel workbook with the examples described on this webpage.
References
Silverman, B. W. (1986) Density estimation for statistics and data analysis. Monographs on Statistics and Applied Probability, London: Chapman and Hall
https://ned.ipac.caltech.edu/level5/March02/Silverman/paper.pdf
Zucchini, W. (2003) Applied smoothing techniques. Part 1: Kernel density estimation
http://staff.ustc.edu.cn/~zwp/teach/Math-Stat/kernel.pdf
Helwig, N. E. (2017) Density and distribution estimation
http://users.stat.umn.edu/~helwig/notes/den-Notes.pdf
I still have the same error with the graph, I still have negative values for the probability density function, using Epanechnikov
When I use the Epanechnikov kernel, I get negative values for the probability density function. What is the cause of that?
Antony,
Can you give me an example where you get a negative value?
Charles
I attach an example: https://prnt.sc/Hkl0hLP06dn8
Hello Antony,
Thanks for sending the screenshot.
I don’t know for sure, but perhaps h is too small and must be larger than h floor.
Charles
I have replicated it manually using the formulas and get the correct results.
I still have the same error with the graph, I still have negative values for the probability density function, using Epanechnikov