We show how to conduct Three Factor ANOVA using capabilities found in the Real Statistics Resource Pack.
Data Analysis Tool
Real Statistics Data Analysis Tool: The Real Statistics Resource Pack provides the Three Factor ANOVA data analysis tool. Two types of input formats are supported. The first format, which we will call standard format by rows is like the input in Example 1 of ANOVA with more than Two Factors.
We will start by looking at this format. We will look at the other format, standard format by columns shortly.
Example
Example 1: Repeat the analysis conducted in Example 1 of ANOVA with more than Two Factors using the Real Statistics Three Factor ANOVA data analysis tool.
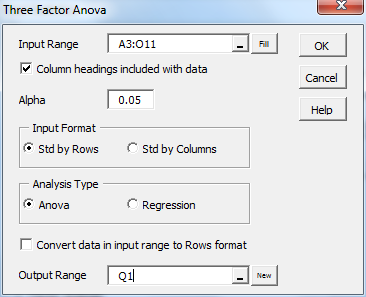
To use the tool for the analysis of Example 1, click on cell Q1 (where the output will start), enter Ctrl-m, and select the Three Factor ANOVA option from the menu that appears. The dialog box in Figure 1 will now appear.
Figure 1 – Dialog box for Three Factor Anova
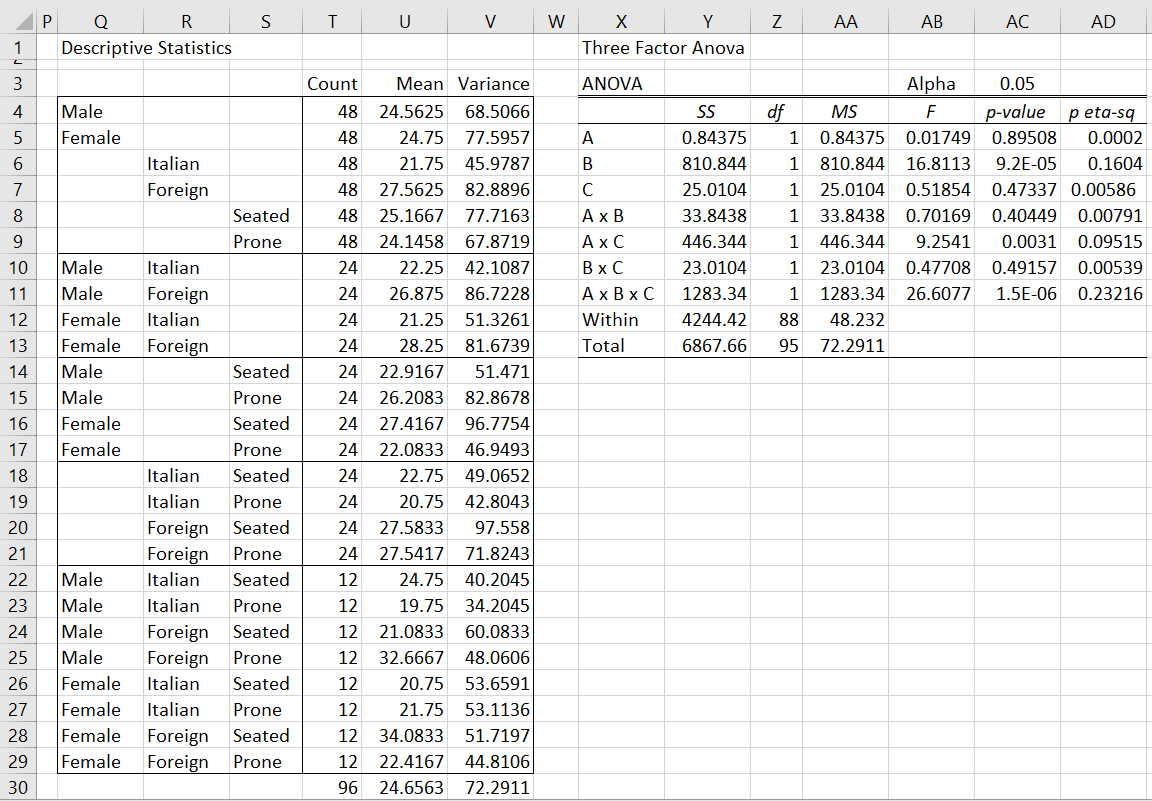
Enter A4:O11 in the Input Range, click on Column headings included with data, select Std by Rows as the Input Format, select Anova as the Analysis Type, and click on the OK button. The output is shown in Figure 2.
Figure 2 – Three-Factor ANOVA data analysis
The left side of the figure contains a table of descriptive statistics. Cell T30 contains the total sample size, cell U30 contains the total mean and cell V30 contains SST. The right side of the figure contains the Anova table, which is similar to the analysis shown in Figure 3 of ANOVA with more than Two Factors.
Data in standard format
As mentioned previously, two input formats are supported by the data analysis tool. In addition to the input format shown above, the data analysis tool also supports standard format by columns. This is similar to the stacked format used for Two Factor Anova.
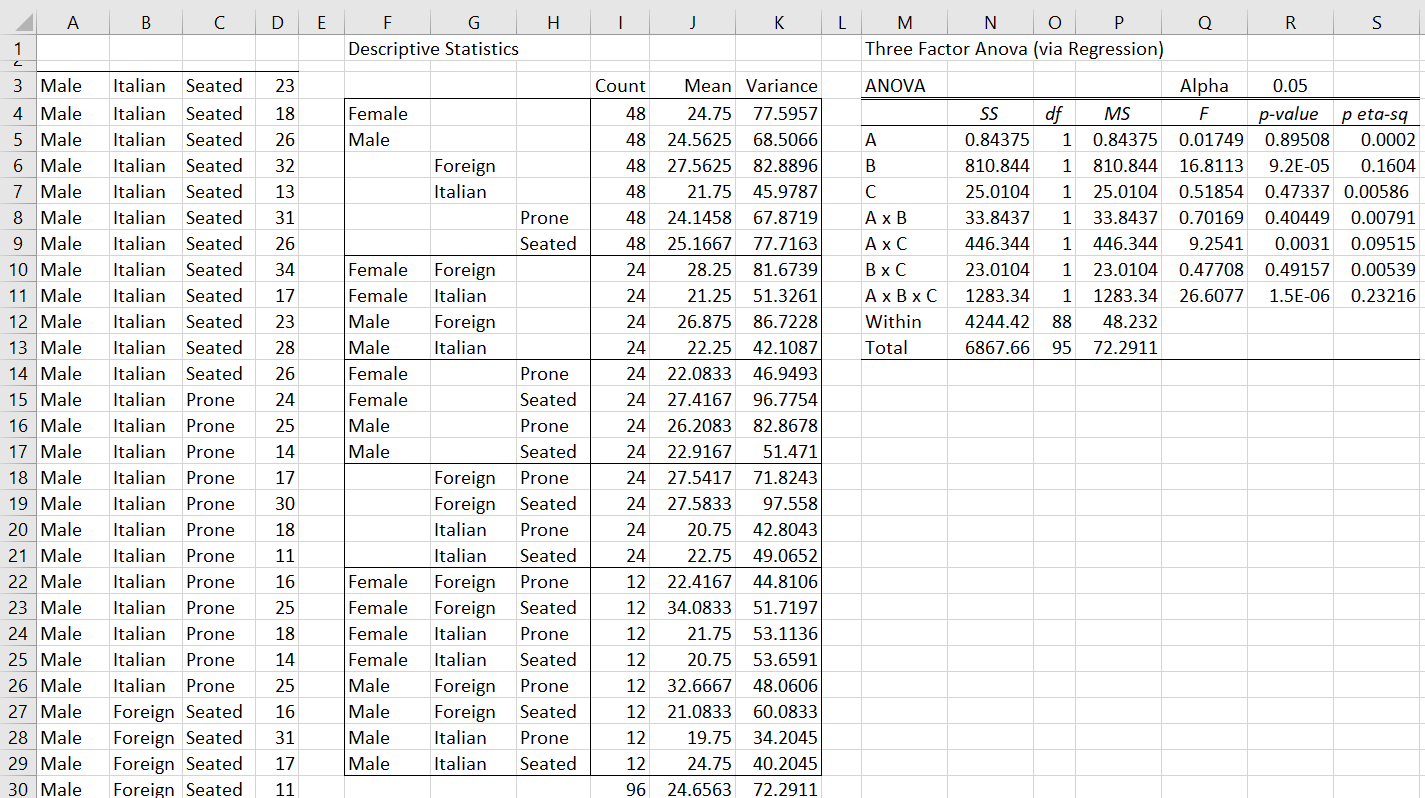
Example 2: Perform an analysis of variance for the data in range A3:D38 of Figure 3.
Figure 3 – Three-Factor ANOVA on data in stacked format
To do this, enter Ctrl-m and select the Three Factor ANOVA option from the menu that appears. When the dialog box in Figure 1 appears, enter A3:D38 in the Input Range. Next, uncheck Column headings included with data, select Std by Columns as the Input Format. Finally, select ANOVA as the Analysis Type, and click on the OK button. The output is shown in Figure 3.
The output is similar to that obtained when the standard by rows input format is used and includes descriptive statistics tables and the ANOVA results. In addition, you have the option to convert the input data into the standard by rows format (in sorted order). To do this, also check Convert data in input range to Rows format in the dialog box shown in Figure 1. The result is displayed in Figure 4.
Figure 4 – Converting from by column to by row format
Worksheet Functions
Real Statistics Functions: The Real Statistics Resource Pack contains the following array functions for converting between the two types of Three Factor Anova formats.
Anova3Rows(R1): takes the data in R1 which is in standard format by columns and outputs an array with the same data in standard format by rows.
Anova3Cols(R1): takes the data in R1 which is in standard format by rows and outputs an array with the same data in standard format by columns.
Referring to Figures 3 and 4, note that =Anova3Cols(A3:D38) generates the output in range T3:V14 and =Anova3Row(T3:V14) generates output similar to that in range A3:D38, but in sorted order.
Unbalanced Models
In all the examples given thus far, the group samples have the same number of elements (balanced model). In Three Factor ANOVA using Regression we show how to use the Regression option of the Three Factor Anova data analysis tool to analyze unbalanced models.
Also when the Regression option is used for input data in standard format by rows the data is automatically converted to standard format by columns (see Three Factor ANOVA using Regression).
Examples Workbook
Click here to download the Excel workbook with the examples described on this webpage.
References
Bao, J. (2021) Two-, three-, and four-way ANOVA
https://sites.pitt.edu/~jub69/material/material/stat1301/Lec/SAS-ANOVA-2.pdf
Laerd (2024) Three-way ANOVA in SPSS statistics
https://statistics.laerd.com/spss-tutorials/three-way-anova-using-spss-statistics.php
Meier, L. (2023) Factorial treatment structure. ANOVA and mixed models: a short introduction using R.
https://people.math.ethz.ch/~meier/teaching/anova/index.html


Dear Charles,
I would like to refer to your website on Real Statistics Support for Three Factor ANOVA at https://real-statistics.com/two-way-anova/real-statistics-support-three-factor-anova/
I had tried to apply the method using the Adds selecting Fixed three-way ANOVA , but got error (refer my email). Could you advise other statistical method can be used using your Adds? Thanks.
Dr. Zaiontz,
I’ve ran a three fixed factor ANOVA and the results table does not show the three-way interaction (missing row), however, it does show all the possible two-way interactions. Any idea why a 3-way interaction row was not generated?
-Maha
Maha,
If you email me an Excel file with your data, I will try to figure out why this is happening.
Charles
Hi Charles,
I’m also having the same missing three way interaction, is there an easy fix to this or do you need a data file?
Thanks!
Scott
Hello Scott,
Yes, please email me an Excel spreadsheet with your data so that I can figure out what is going wrong.
Charles
I’m trying to analyze a field experiment with plants but since some of them plants died during the trial, I do not have the data for all. This is why I’m facing this “cannot contain empty cells” error, either if I try to run analysis type as ANOVA or regression. Any workaround?
It is multifactorial hence I cannot run as you explain in “RCBD with missing data using regression”
Thank you!
-PHM
You can try one of the techniques for handling missing data that is described at
https://www.real-statistics.com/handling-missing-data/
The usual approach is to eliminate any subject that contains any missing data (listwise deletion). This usually works if you have a relatively small amount of subjects with missing data. The main caution is to make sure that plants dying (or not dying) isn’t related to what hypothesis you are trying to test.
Charles
Thank you for developing and sharing this add-in. It’s very useful. I had one problem when running the analysis. The SS were negative for all of the 2-way interactions, resulting in the #NUM! error for all p-values.
Is it possible to run the analysis with only the main effects?
Paul,
SS should never be negative. I can think of two reasons for getting a negative value: (1) it is a negative value near zero, in which case you should interpret it as zero and (2) you have an unbalanced model and need to use the Regression option. Perhaps it could also happen if there are no interactions.
If you email me an Excel file with your data and test results, I will try to figure out what is going wrong.
Charles
Please disregard my earlier comment about #NUM! error. A typo resulted in three different categories rather than two and this seemed to be the cause. Thanks!
I occasionally get #NUM! in the p-value and sig columns accompanied by negative MS, SS, and F-value numbers. Why might this be?
I would note that my fourth column is always numerical (may be positive or negative) while the first three columns are categorical. Thanks!
Thank you sir, for tree factor analysis …tools .. it is very easy to use for me .
Dear Charles,
I have run an experiment looking at the effect of different feed on animal growth at different time points at 3 different time points (1, 10 and 20 months). I have used a total of three different animals.
So I have two fact one variable (growth), two factors (feed and time) and I want to block by animal to deal with nuisance factors.
Please, is there a way to do this using Real Statistics in Excel?
Many thanks,
Eden,
Should I consider the the three different animals as three different types of animals (sheep, cow, pig, for example) or as replications (cow 1, cow 2, cow 3, for example)? As far as the feed is concerned, how many types of feed are being used and do different animals eat different feed or each of the different types in different periods of time?
Charles
Dear Charles,
I have used you 2 way ANOVA follow-up for my data before and it was really useful. Now I have extended my experiments and I need to do post-hoc tests on my 3 way ANOVA (2 factors with 2 levels and one with 3). I was wondering if I could do the 2 way Anova follow up 7 times to account for all the intereactions or if I would need a specific 3 way ANOVA follow up to account for other factors I don’t know about? (my background is not stats…)
Thanks!
Dear Dr. Zaiontz,
Can I use 2 factors that are discrete and one is not discrete?
Boris,
Yes, but you still need to take the assumptions of normality and homogeneity of variances into account.
Charles
Dear Charles
I am having 3 factors at 3 levels with 3 replications with one Control. 28 treatments. How to analyse please guide me
This situation is described on the referenced webpage. What parts of it are you having trouble with?
Charles
I running a 3 factor (say time, temp and brand) with 2 levels for each factor test. I have 1 result for each test, for example time=10mins, temp=180degC and brand=1 the result is 23units. When I run a 3 factor ANOVA test the ‘within’ column is 0 (zero) and hence the F value cannot be calculated. What am I doing wrong?
If I have 2 results for each test then it works.
Nick,
This version of the test is with replication and so requires at least 2 values per interaction.
Charles
Hey Charles,
I’ve been running 3-way ANOVA’s on my data for a while now but only noticed something curious today. It may not even be an issue, but I thought I would bring it up in the event that it is.
When looking at the ANOVA table output for the 3-way ANOVA, the p-value generated for the A*C interaction uses the degrees of freedom (df) for A*B instead of its own df. I noticed this because I ran some numbers through Minitab and sometimes found that your program and Minitab would give different results. However, when I changed the A*C p-value formula to use the df of A*C the p-value matched the p-value given by Minitab perfectly.
I was wondering if there was any reason for using the df of A*B instead of A*C when calculating the p-value for A*C?
Thanks,
Aaron 🙂
Hi Aaron,
You are correct. There is a bug in the software, which I will correct shortly.
Thank you very much for finding this error. I apologize to you and everyone else for not identifying this error previously.
Charles
Hi Aaron,
I have now fixed the bug in the software. The corrected version is now available for download (Rel 4.4.3).
Thanks again for your help.
Charles
Is it possible to use this factorial design with 8 different factors?
The factorial design described on the referenced webpage is limited to 3 factors. The same approach will work for 8 factors, but the actual design will require considerable modification. In any case, I am not anyone would be able to analyze an Anova model with 8 factors; it would be too complicated.
Charles