Basic Concepts
We show how to use One Factor ANOVA capabilities to perform omnibus follow-up analyses after a two-factor ANOVA. Generally, these are not the best choices for follow-up analysis. Contrasts and Tukey HSD usually are better choices.
Two-way ANOVA Example
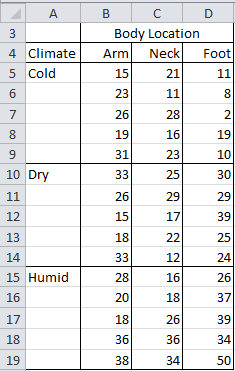
Example 1: A research team has investigated whether mosquitoes bite specific parts of the body (arm, neck, foot) more often than others and whether there are differences depending on the climate of the room (cold, dry, humid). Five people were studied for each combination, with the number of bites recorded in the table shown in Figure 1.
Figure 1 − Data for Example 1
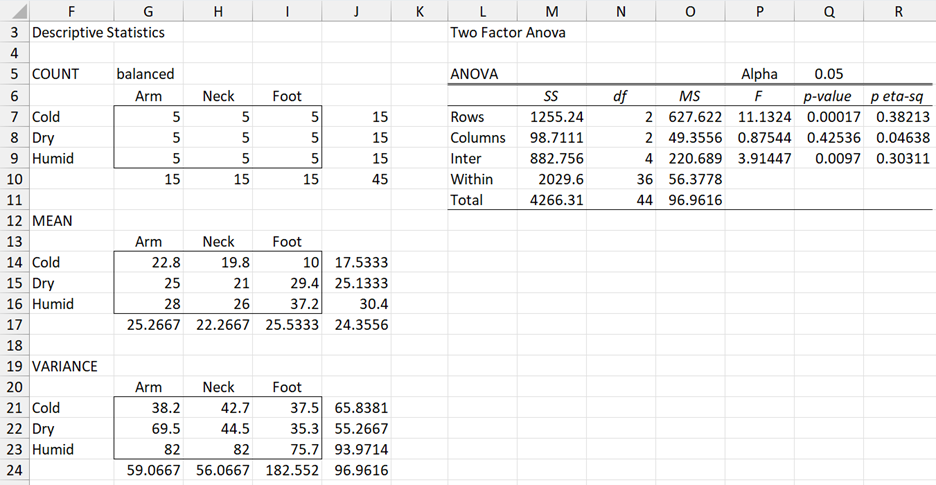
We conduct a two-way ANOVA using the Real Statistics Two Factor ANOVA data analysis tool, as described in Real Statistics Support for Two Factor ANOVA, obtaining the results shown in Figure 2.
Figure 2 − ANOVA output from Real Statistics data analysis tool
From the ANOVA report, we see there are significant differences between the climate and interaction means, but not between the body parts.
Reformatting Output
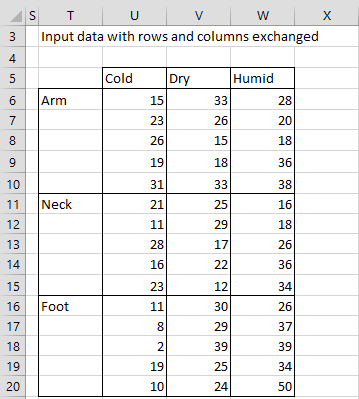
If we check the Display input flipping rows and columns option in the Two Factor ANOVA dialog box (as shown in Figure 1 of Real Statistics Support for Two Factor ANOVA) we obtain the output shown in Figure 3.
Figure 3 – Flipped input data
Follow-up One-Factor ANOVA Tests
Main effects
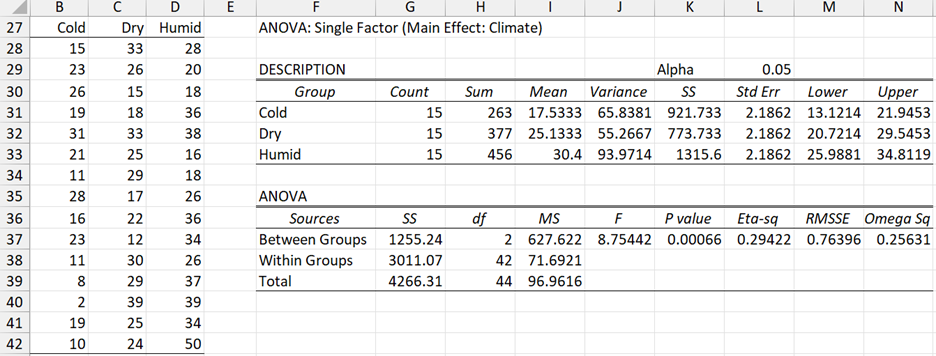
There are two main effects: Climate and Body Location. The Climate effect compares the means for the Cold, Dry, and Humid climates, ignoring the specific Body Locations. The analysis of the Climate main effect can be done using Excel’s Single Factor Anova data analysis tool based on the output in Figure 3 where we don’t distinguish the body locations.
From the output shown in Figure 4, we see there is a significant difference (p-value = .00066 < .05 = α) between the different climates.
Figure 4 – ANOVA output for Climate main effect in Example 1
Simple effects
This time we compare the group means of one factor where the data is restricted to only one level of the other factor. E.g. we can compare the means of each of the Body Locations only for the Cold climate. The analysis is identical to a one-way ANOVA looking only at the sample for Cold. From the output displayed in Figure 5, we see there is a significant difference (p = .0184 < .05 = α) in body locations for the cold climate.
Figure 5 – ANOVA output for Cold simple effect in Example 1
We can also show that the simple effect for Neck vs. climate is not significant, as displayed in Figure 6.
Figure 6 – ANOVA output for Neck simple effect in Example 1
Contrasts
In addition to the follow-up tests that correspond to the effects defined above, we can explore contrasts for one-way ANOVA (see Planned Comparisons). We won’t go any further with this since it is better to use the follow-up tools specifically designed for two-factor ANOVA (see Contrasts for Two Factor ANOVA).
Examples Workbook
Click here to download the Excel workbook with the examples described on this webpage.
Reference
Howell, D. C. (2010) Statistical methods for psychology (7th ed.). Wadsworth, Cengage Learning.
https://labs.la.utexas.edu/gilden/files/2016/05/Statistics-Text.pdf


Is a correction for family-wise or experiment-wise error rate not needed when using single factor ANOVAs to follow-up a factorial ANOVA?
Probably, yes. In any case, I can’t think of any reason for using Single Factor ANOVA as the follow-up test after Two Factor ANOVA. As stated on the webpage, it is better to use a follow-up test like Tukey HSD.
Charles