PROX Example
Example 1. Repeat Example 1 of Building a Rasch Model using the PROX algorithm described in PROX Model for Rasch Analysis.
On the left side of Figure 1, we repeat the data from Figure 1 of Building a Rasch Model and calculate the total score for each subject, xs, and each item, xi. E.g. the value of xA in cell L4 is calculated by =SUM(B4:K4) and the value of pA in cell M4 is calculated by =L4/(COUNT(B4:K4)*P$4). Note that cell P4 contains the value of the highest score, which is 1 for this example, but which may take higher values in other examples.
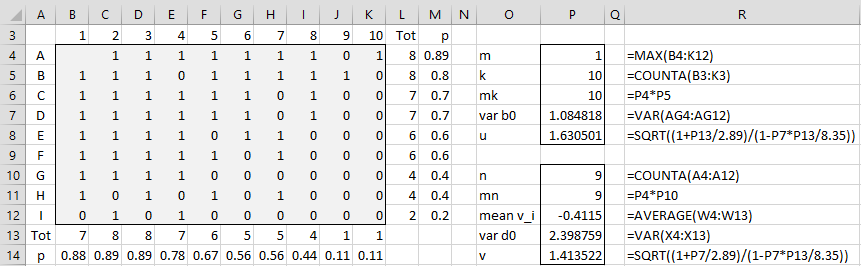
Figure 1 – PROX method (part 1)
Difficulty parameters
We will describe the other cells on the right side of the figure in a moment, but first, we describe the left side of Figure 2. Columns T, U, and V are simply the transposes of ranges B3:K3, B13:K13, and B14:K14. Cell W4 contains the formula =LN((1-V4)/V4) and cell X4, which represents v1 – v-bar, contains the formula =W4-P$12 where cell P12 contains the mean of the logit values from column W. We can fill in all the other values in columns W and X by highlighting the range W4:X13 and pressing Ctrl-D.
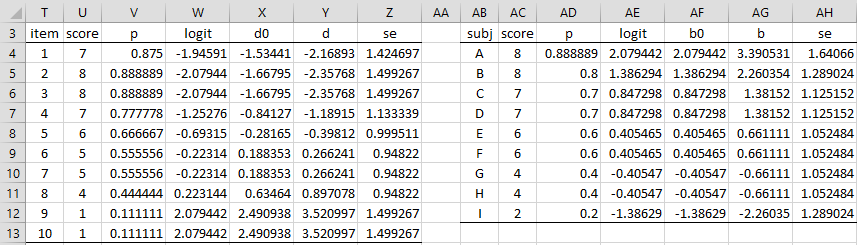
Figure 2 – PROX method (part 2)
We now need to calculate the value of the scaling factor v so that we can in turn calculate di = v(vi – v-bar) for all i. The value of v is 1.4135 as shown in cell P14 of Figure 1. Thus, d1 = 1.4135 ⨯ -1.5344 = -2.1689, as shown in cell Y4 using the formula =X4*P$14. The standard error for d1, shown in cell Z4, is calculated by =P$14/SQRT(P$11*V4*(1-V4)). The other difficulty parameters and their standard errors, as shown in columns Y and Z, are calculated in the same way.
Ability parameters
The ability parameters and their standard errors are calculated in the same manner as shown on the right side of Figure 2, although there are a few differences. E.g. we can calculate uA by the formula =LN(AD4/(1-AD4)) in cell AE4, and similarly for the other subjects. The us values in column AF are the same as those in AE since, unlike for the difficulty parameters, no correction by the mean of the us is needed. Since bs = u · us, we now obtain the values in column AG by multiplying the values in column AF by the u value in cell P8 shown in Figure 1.
Observations
Note that even though none of the subjects has a score of 1, 3, or 5, we can still calculate an ability level for any subject with these scores. This is because we can obtain a b0 value for any such subject in exactly the same manner as any of the subjects who actually took the test. We can then multiply this b0 value by the u value shown in cell P8. The same is true for any item that is not in the test. We will return to this issue in Real Statistics Support for PROX.
The ability and difficulty estimates based on the UCON method are on average about 10% higher than those values obtained from the PROX method, at least for these data. All the standard errors obtained using the UCON method are smaller than those obtained from the PROX method, with an average improvement of about 18%.
Examples Workbook
Click here to download the Excel workbook with the examples described on this webpage.
References
Wright, B. D. and Stone, M. H. (1979) Best test design. MESA Press: Chicago, IL
https://research.acer.edu.au/measurement/1/
Wright, B. D. and Masters, J. N. (1982) Rating scale analysis. MESA Press: Chicago, IL
https://research.acer.edu.au/measurement/2/
H Charles
Can you create :Figure 2 – PROXX_SUBJ and PROXX_ITEM functions (from the next page) without using your PROX command set?
Hi Chris,
If I understand your question correctly, then the answer is yes. This is the motivation behind the first Observation on this webpage.
Charles
Hello Charles
I can create this table (figure 1, Support for PROX method): https://www.real-statistics.com/wp-content/uploads/2019/08/prox-analysis-output.png
But I cannot work out how you get to figure 2, https://www.real-statistics.com/wp-content/uploads/2019/08/proxx-functions.png
without using the non base excel PROXX_SUB and ITEM commands
Hi Chris,
I wanted to say that you could look up the answer on the Correlation and Reliability examples workbook (see my response to another of your comments), but I checked it only the PROXX_SUBJ and PROXX_ITEM functions are used on the workbook.
In any case, I will speak about the ability scores on Figure 2 of https://www.real-statistics.com/reliability/item-response-theory/prox-method-support/. Note that scores 2,4,6,7 and 8 correspond to raw scores for subjects in the sample data. E.g. subjects A and B had a score of 8 and so you will note that the ability scores for subjects A and B from Figure 1 will agree with the ability score for raw score 8 that is shown in Figure 2. The calculation of the ability values for subjects for which we have data is described in Figure 2 of https://www.real-statistics.com/reliability/item-response-theory/prox-model-example/. The ability values for subjects with scores 1,3, and 5 are calculated in the same way as described for subjects for which we had data (even though none of the subjects for which we have data had any of these 3 scores).
Charles
How do I do this using just excel functions
Thanks
Chris
Hi Chris,
I suggest that you look at the PROX examples shown on the Correlation and Reliability examples workbook. You can download this file, for free, from the following webpage: https://www.real-statistics.com/free-download/real-statistics-examples-workbook/
Charles
Hi Chris,
See the response I just sent to a later comment.
Charles
So if you use the PROX method you don’t need to do “iterations” and subsequently the PROX method may not be as accurate?
Chris,
Yes, this is correct. The PROX method is not iterative. The UCON method is more accurate than the PROX method.
Charles