Worksheet Functions
Real Statistics Functions: The Real Statistics Resource Pack contains the following functions:
PROX_SUBJ(R1): returns a summary of the PROX method for the data in R1 (with headings) consisting of 4 columns: subject labels for each of the subjects in R1, corresponding ability parameter estimates, standard errors, and % correct scores.
PROX_ITEM(R1): returns a summary of the PROX method for the data in R1 (with headings) consisting of 4 columns: item labels for each of the items in R1, corresponding difficulty parameter estimates, standard errors, and % correct scores.
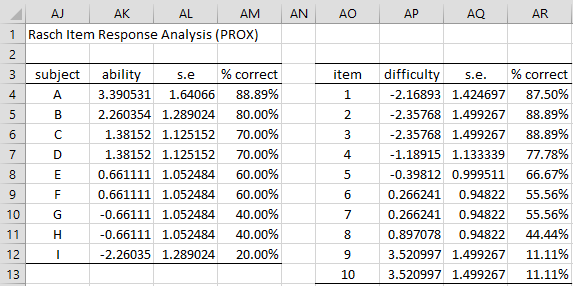
These functions are employed by the PROX Method option of the Rasch Item Response Analysis data analysis tool described in Real Statistics Support for Rasch Analysis. For Example 1 of Building a Rasch Model, the data analysis tool returns the output shown in Figure 1.
Figure 1 – Output from PROX option
Range AJ3:AM12 contains the array formula =PROX_SUBJ(A3:K12) based on the input in A3:K12 shown in Figure 1 of PROX Model Example. Range AO3:AR13 contains the formula =PROX_ITEM(A3:K12).
More Worksheet Functions
As observed in PROX Model Example, we can obtain the ability level for any subject based on their total score even if they didn’t take the test. The following two functions implement this capability.
Real Statistics Functions: The Real Statistics Resource Pack contains the following functions:
PROXX_SUBJ(R1, R2): returns a two-column array consisting of ability parameter estimates and standard errors corresponding to the subject scores in the column array R2 based on the PROX method for the data in R1 (w/o headings).
PROXX_ITEM(R1, R2): returns a two-column array consisting of difficulty parameter estimates and standard errors corresponding to the item scores in the column array R2 based on the PROX method for the data in R1 (w/o headings).
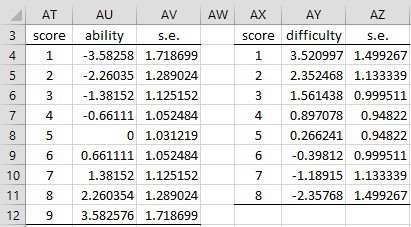
E.g, range AU4:AV12 of Figure 2 contains the worksheet array formula for subjects =PROXX_SUBJ(B4:K12,AT4:AT12). Range AY4:AZ11 contains the corresponding worksheet array formula for items =PROXX_ITEM(B4:K12,AX4:AX11). These formulas refer to the range B4:K12 shown in Figure 1 of PROX Model Example.

Figure 2 – PROXX_SUBJ and PROXX_ITEM functions
We see from the figure, for example, that a subject who obtains a score of 8 correct items out of 10 has an ability of 2.260354 (cell AU11). This is the same as subject B (cell AK5 of Figure 1). A subject who obtains a score of 3 correct items out of 10 has an ability of -1.38152 (cell AU6). This is so even though no subject had such a score in the original data.
Examples Workbook
Click here to download the Excel workbook with the examples described on this webpage.
References
Wright, B. D. and Stone, M. H. (1979) Best test design. MESA Press: Chicago, IL
https://research.acer.edu.au/measurement/1/
Wright, B. D. and Masters, J. N. (1982) Rating scale analysis. MESA Press: Chicago, IL
https://research.acer.edu.au/measurement/2/

Hi Charles,
Is there a limit on the number of cases?
Thanks, Stephen
I assume that by cases, you mean subjects x items. I don’t know of a limit. If there is one, it is probably around 65,000, although it is probably higher.
Charles
Does the Difficulty Table only work for Binary Outcome ( 0 or 1 score)
I have a test with each question worth between 0 to 5 and it doesn’t seem to calculate it
Chris,
It should still work for scores between 0 and 5.
If you email me an Excel file with your data and results, I will try to figure out what went wrong.
Charles
Hello Charles
I believe that Table AT3 to AU12 shows the calculated subject ability value for all possible test scores
What does Table AX3 to AZ11 show, the score is all possible scores up to the max obtained in the test, but I don’t understand how the difficulty and score relate
Hello Chris,
The approach for difficulty is similar to that for ability. See
https://www.real-statistics.com/reliability/item-response-theory/prox-model-rasch/
https://www.real-statistics.com/reliability/item-response-theory/prox-model-example/
Charles