We now show how to build a polytomous Rasch model based on the approach described in Polytomous Model Basic Concepts.
Example
Example 1: Nine registered voters were given a questionnaire consisting of ten questions regarding their assessment of the US Congress. For each question, they were asked to rate their satisfaction with Congress based on the characteristics described by each question. They assigned ratings of 0 (dissatisfied), 1 (neutral or no opinion), or 2 (satisfied) as described in Figure 1.
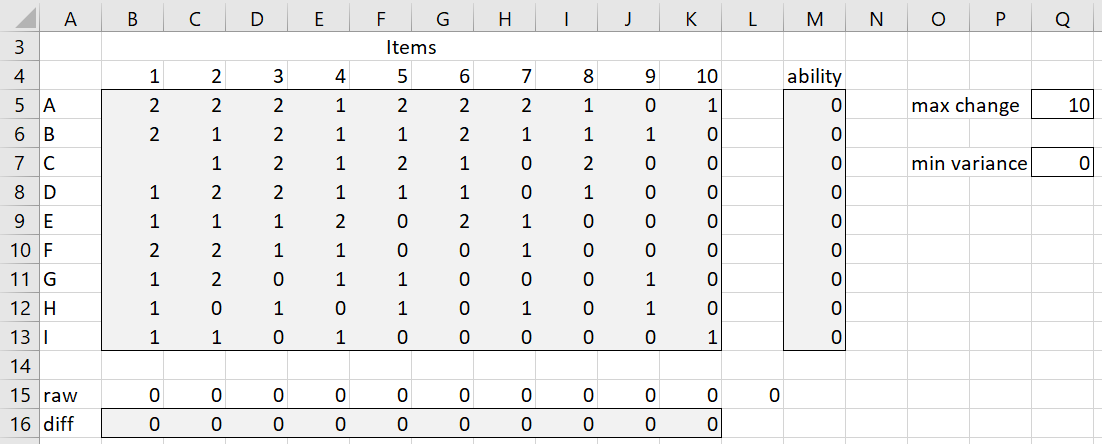
Figure 1 – Raw data
To initialize this Rasch model, we assign the ability and difficulty parameters to all zeros. Here, low difficulty values correspond to more dissatisfaction and higher difficulty values correspond to higher satisfaction. Similarly, lower ability values correspond to more dissatisfaction and higher ability values correspond to higher satisfaction. Note that the max change and min variance are tuning factors that are used later in the algorithm.
Step 1 (part 1)
The first step in the algorithm is shown in Figure 2.
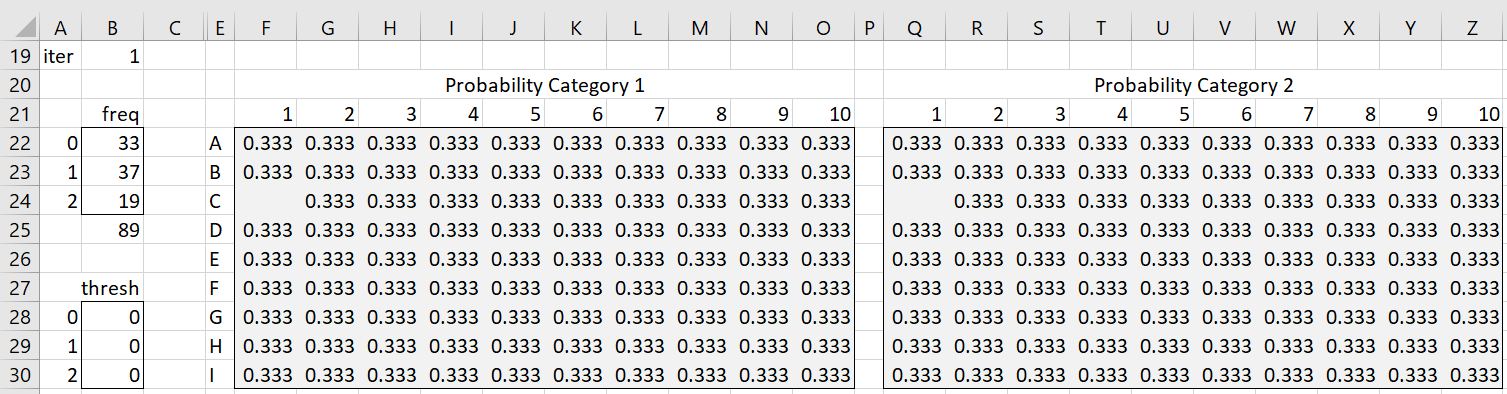
Figure 2 – Step 1 (part 1)
Range B22:B24 contains the observed frequencies. E.g., there are 33 zero scores as calculated by the formula =COUNTIF($B$5:$K$13,A22). There are 89 scores, as calculated by =SUM(B22:B24), and one missing score. The threshold values, the τk, in range B28:B31, are initially set to zero.
The rest of the figure contains the P(x = 1) and P(x = 2) values for each of the 89 non-missing subjects/items. Note that the values of the P(x = 0) are simply 1 – P(x = 1) – P(x = 2). E.g. the value of P(x = 1) for subject A and item 1 (cell F22) is calculated by the formula
=IF(ISNUMBER(B5),EXP($M5-B$16-$B$29)/(1+EXP($M5-B$16-$B$29)+EXP(2*($M5-B$16))),””)
and the corresponding value of P(x = 2) in cell Q22 is calculated by the formula
=IF(ISNUMBER(B5),EXP(2*($M5-B$16))/(1+EXP($M5-B$16-$B$29)+EXP(2*($M5-B$16))),””)
These formulas refer to the then-current values of the ability, difficulty, and threshold parameters.
Step 1 (part 2)
Step 1 continues as shown in Figure 3.
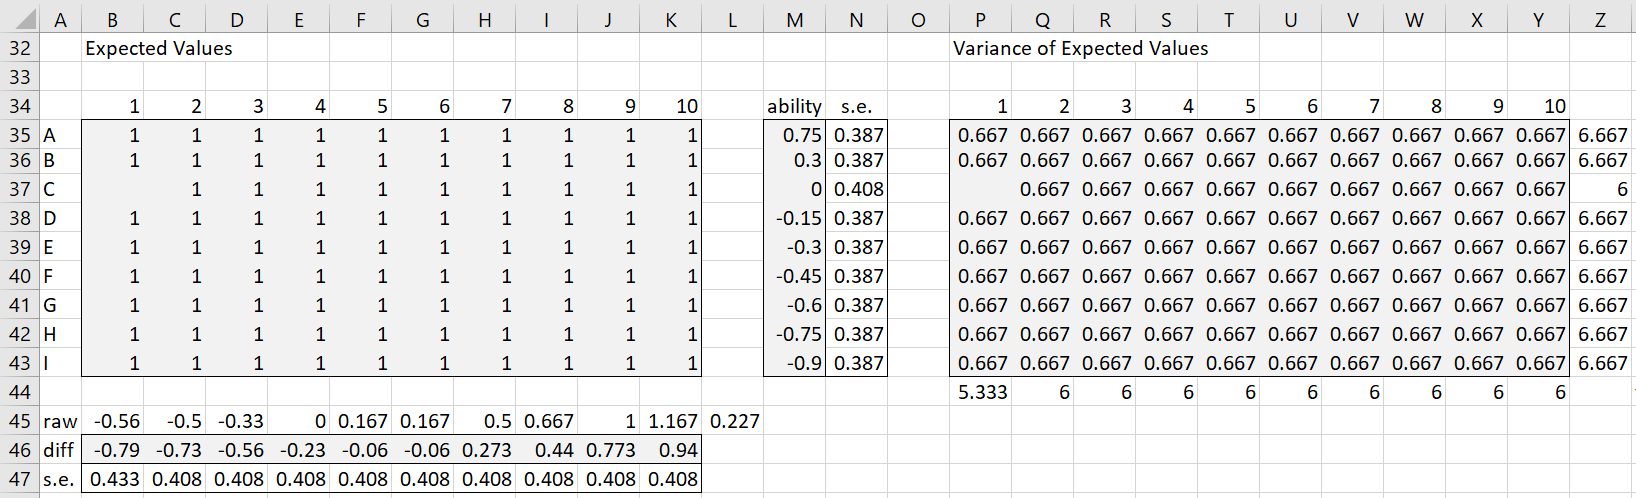
Figure 3 – Step 1 (part 2)
The first iteration of the expected values for the xsi is shown in range A34:K43. E.g. the expected value for subject A and item 1 (cell B35) is calculated by the formula =IF(ISNUMBER(B5),F22+2*Q22,””).
The first iteration of the variance values for the expected xsi are shown in range P34:Y43. E.g. the variance for xA1 (cell P35) is calculated by the formula =IF(ISNUMBER(B5),F22+4*Q22-B35*B35,””).
The values in column Z are the sum of the variances in each row, 35 through 43, and the values in row 44 are the sum of the variances in each column P through Y. E.g. cell Z35 contains =SUM(P35:Y35) and cell P44 contains =SUM(P35:PP43). The corresponding standard error for the ability and difficulty parameters are the reciprocals of the square root of these values. E.g. cell N35 contains =1/SQRT(Z35) and cell B47 contains the formula =1/SQRT(P44).
Step 1 (part 3)
Calculating the ability and difficulty parameters requires the residuals, as shown in Figure 4.
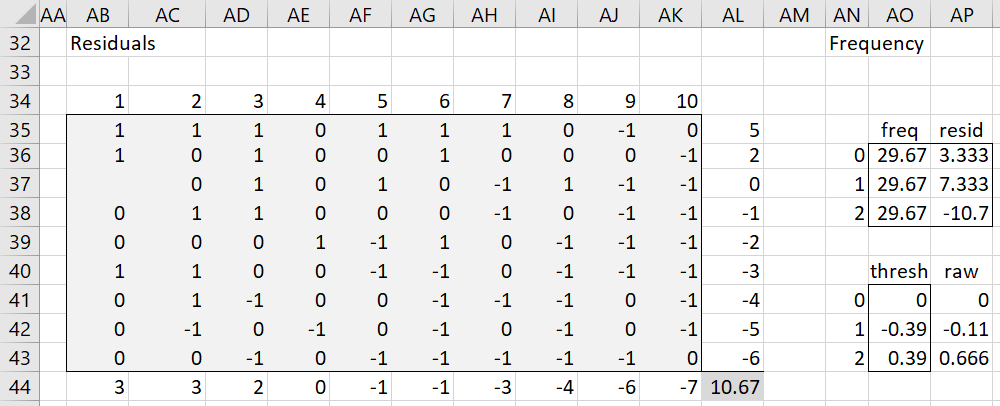
Figure 4 – Step 1 (part 3)
Here, cell AB35 contains the formula =IF(ISNUMBER(B5),B5-B35,””), cell AL35 contains =SUM(AB35:AK35) and cell AB44 contains =SUM(AB35:AB43).
Updating the ability parameters
Using the residuals shown on the left side of Figure 4, we can now update the estimated ability and difficulty parameters shown in Figure 1 to those shown in Figure 3. E.g. the ability of subject A (cell M35) is calculated by the formula
=IF(Z35>0,M5+MIN(MAX(AL35/Z35,-$Q$5),$Q$5),0)
Ignoring the tuning parameter in cell Q5 which limits the amount of change to the previous estimate, this formula is equivalent to =M5+AL35/Z35. This means that we are changing the previous estimate (in cell M5) by adding the standardized residual AL35/Z35.
Updating the difficulty parameters
The approach for updating the difficulty value is similar. E.g. cell B45 contains the formula
=IF(P44 > 0,B18-MIN(MAX(AB44/P44,-$Q$5),$Q$5),0)
As we did in the dichotomous case, we then calculate the average of the raw difficulty values (cell L45) and then subtract this value from each of the raw difficulty values to obtain the difficulty values shown in range B46:K46. This ensures that the average of the difficulty parameters is zero. E.g. cell L45 contains =AVERAGE(B45:K45) and cell B46 contains =B45-$L45.
Updating the threshold values
Finally, we update the threshold values, as shown on the right side of Figure 4.
First, we calculate the estimated frequency values, as shown in range AO36:AO38. The estimated frequency for a score of 1 (cell AO37) is calculated by the formula =SUM(F22:O30). Similarly, the estimated frequency for a score of 2 (cell AO38 is calculated by =SUM(Q22:Z30). The estimated frequency for a score of zero (cell AO36) is therefore 89 minus the frequency values for 1 and 2, i.e. cell AO36 contains the formula =B$25-SUM(AO37:AO38).
We now use these expected frequency values to update the raw threshold values. E.g. cell AP41 contains zero (since τ0 is always set to zero), cell AP42 contains =B28+LN(B$22/B$23)-LN(AO36/AO37) and cell AP43 contains =B29+LN(B$23/B$24)-LN(AO37/AO36). Since we want the average of the threshold values to be zero, we need to subtract the average of the raw τk values excluding τ0 from each of the raw τk values. E.g. cell AO42 contains =AP42-AVERAGE(AP42:AP43) and cell AO43 contains the formula =AP43-AVERAGE(AP42:AP43).
Iteration
In Step 2 we will use the new ability, difficulty, and threshold values in a similar way. We continue this process until the latest ability, difficulty, and threshold values don’t change very much. More specifically, at each step in the iteration, we determine the maximum of the residuals relating to the ability, difficulty, and threshold parameters. We stop the iteration when this value is less than some predefined objective.
For step 1, this value is 10.67 as shown in cell AL44 of Figure 4, as calculated by the formula
=MAX(ABS(AL35:AL43),ABS(AB44:AK44),ABS(AP36:AP38))
This value becomes 4.42, 3.19, 2.09, 1.45, etc. in the next few iterations. In fact, it would take 25 iterations to get this value below .001. After 25 iterations we arrive at the expected scores, ability, and difficulty values shown in Figure 5.
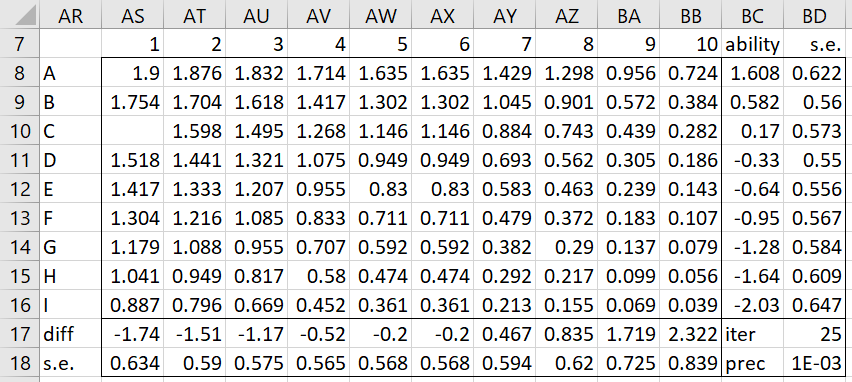
Figure 5 – Rasch model result
Examples Workbook
Click here to download the Excel workbook with the examples described on this webpage.
References
Wright, B.D. & Masters, G.N. (1982) Rating scale analysis. Chicago: MESA Press
https://research.acer.edu.au/measurement/2/
Ataei, S.and Mahmud, Z. (2015) Rasch-Andrich thresholds in engineering students’ attitudes towards learning mathematics
https://www.semanticscholar.org/paper/Rasch-Andrich-Thresholds-in-Engineering-Students%E2%80%99-Ataei-Mahmud/1b60dc7d5a3be98db220d29b957de55e4550d2e2
Hi Charles,
I understand that his implementation is using UCON to estimate parameters, right. I tried to solve for the standard datasets presented in https://www.rasch.org/rmt/rmt281b.htm. For example, I tried the present algorithm for this example (similar to example 1)
0 0 1
0 1 0
1 0 0
Shouldn’t I have obtained abilities = [0, 0, 0] = [0, 0, 0] = difficulties?
I am obtaining abilities = [-0.69, -0.69, -0.69] and difficulties = [0, 0, 0]
In my reasoning, all questions and students should be identical. What do you think?
Thanks!
Hello Ciro,
I must confess that I don’t have an intuition for UCON, and so I can’t really say what the values should be.
Charles