Basic Concepts
The triangular distribution is a continuous distribution defined by three parameters: the smallest (a) and largest (c), as for the uniform distribution, and the mode (b), where a < c and a ≤ b ≤ c. This distribution is similar to the PERT distribution, but whereas the PERT distribution has a smooth shape, the triangular distribution consists of a line from (a, 0) up to (b, m) and a line from (b, m) back down to (c, 0) where m = the pdf at b.
Like the PERT distribution, the triangular distribution can be useful when you only have limited information about a distribution but can estimate the upper and lower bounds, as well as the most likely value.
In the mean for the triangular distribution, the three parameters have equal weight, unlike in the PERT distribution where the mode has 4 times the weight of the other two parameters.
The pdf is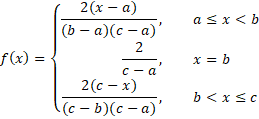
The shape of the pdf curve is a triangle.
The cdf is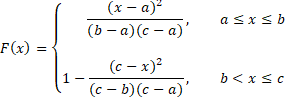
The inverse function is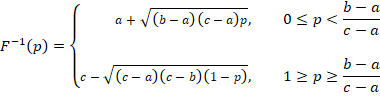
Properties
Key statistical properties of the triangular distribution are given in Figure 1.
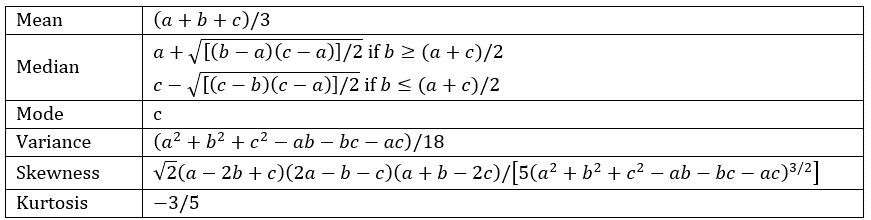
Figure 1 – Key properties of the triangular distribution
Worksheet Functions
Real Statistics Functions: Excel provides the following functions:
TRIANG_DIST(x, a, b, c, cum) = the pdf of the triangular function f(x) when cum = FALSE and the corresponding cumulative distribution function F(x) when cum = TRUE.
TRIANG_INV(p, a, b, c) = x such that TRIANG_DIST(x, a, b, c, TRUE) = p; i.e. the inverse of the cdf of the triangular distribution.
References
Leemis, L. (2012) Triangular distribution. College of William & Mary
http://www.math.wm.edu/~leemis/chart/UDR/PDFs/TriangularV.pdf
GoldSim (2019) Help on Triangular Distribution
https://help.goldsim.com/Content/GS/triangulardistribution.htm
Charles has explained the Triangular distribution, its density function, and cumulative, as well as the inverse function, quite well. You can use this if you need to find a random variable that has a Trianglular distribution and easily create an Excel worksheet.
Hi,
Where can I find triangular distribution in the adds-in, please?
Hello Milan,
It is not one of the data analysis tools. It can be calculated via a worksheet function, just all the other distributions supported in Excel.
Charles
The triangular distribution was the base for creating the SMp(x) function of [Frometa-Castillo T. The SMp(x or y;PXmin,Xmax,ML,p1,p2,Max) a probabilistic distribution, or a probability density function of a random variable X, Chapter 48 of 16th International Conference on Information Technology-New Generations (ITNG 2019), Springer Nature Switzerland AG. (2018). Available in: https://link.springer.com/chapter/10.1007/978-3-030-14070-0_48%5D
Thanks for the Functions. I was confused, because I got wrong Outcomes. The most sources declare B and C on the Opposite way, that was my mistake.