Basic Concepts
In the testing described in One-Sample Runs Test, there are two categories (e.g. T and H, or 1 and 2). We now consider the case where there are 3 or more categories. We’ll call these 1, 2, 3, … For any given sequence consisting of k categories, let’s suppose there are nj repetitions of category j and suppose the length of the sequence is n = n1 + … + nk. If the null hypothesis is true that the sequence is random, then for n big enough the number of runs r follows a normal distribution with
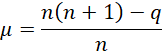
 where
where

Example
Example 1: Determine whether the following sequence is random.
ABBCCBAACCACBBAABBBC
We see that there are 12 runs: A BB CC B AA CC A C BB AA BBB C
Since the p-value for the two-tailed test is bigger than the significance level α = .05, we conclude there isn’t enough evidence to say that the sequence is not random. The analysis is shown in Figure 1.
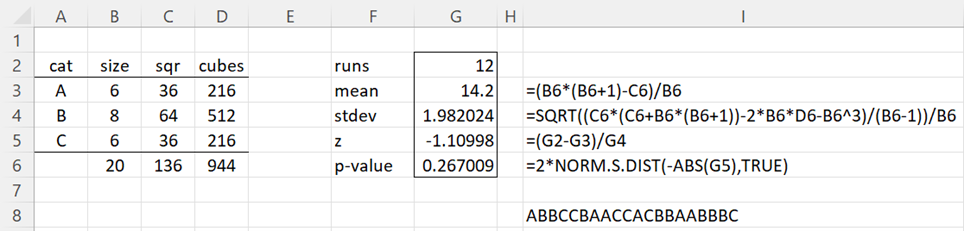
Figure 1 – Runs Test
Note that to obtain the values in column B, we can insert the formula =LEN(I$8)-LEN(SUBSTITUTE(I$8,A3,””)) in cell B3, highlight range B3:B5, and press Ctrl-D.
Worksheet Functions
Real Statistics Functions: The Real Statistics Resource Pack provides the following worksheet functions.
RUNS_TEST(s, tails) = the p-value of the above runs test for the sequence defined in the string s.
RUNS_TEST(R1, tails) = the p-value of the above runs test for the sequence defined by the column or row array or range R1.
RUNS(s) = the number of runs in string s
RUNS(R1) = the number of runs in the row or column array or range R1.
tails = 1 or 2 (default).
To obtain the runs count in cell C2 of Figure 1, we can use the formula =RUNS(I8), and to obtain the p-value in cell G6, we could use the formula RUNS_TEST(I8).
Observation
The p-value from the runs test described on this webpage will match those for the traditional runs test with only two categories described in One-Sample Runs Test.
For example, the p-value obtained for Example 1 in One-Sample Runs Test is .795676, which can be obtained using the RUNSTEST function. Using the RUNS_TEST function described on this webpage, we obtain the same p-value.
Links
Examples Workbook
Click here to download the Excel workbook with the examples described on this webpage.
Reference
Sheskin, D. J. (2000) Handbook of parametric and nonparametric statistical procedures 2nd Ed. Chapman & Hall/CRC
https://psycnet.apa.org/record/2000-08524-000
How do you calculate an exact p-value for the above? I assume the p-value in cell G6 is an asymptotic p-value
Hello Cameron,
Yes, the p-value is approximate. I have not tried to produce an exact p-value. I assume that the approach is similar to that for two categories, but there will be more possibilities.
Charles