Background
Determining whether data is multivariate normally distributed is usually done by looking at graphs. First, you determine whether the data for all the variables in a random vector are normally distributed using the techniques described in Testing for Normality and Symmetry (box plots, QQ plots, histograms, analysis of skewness/kurtosis, etc.).
You can then check to see whether the data follows a multivariate normal distribution by looking at multi-dimensional graphs. Although we provide more insights into how this is done in MANOVA Assumptions, this is difficult and so it is usually not done or only partially done. For large enough samples you usually rely on the Multivariate Central Limit Theorem.
Basic Concepts
Another way to test for multivariate normality is to check whether the multivariate skewness and kurtosis are consistent with a multivariate normal distribution. Here we use Mardia’s Test. For a sample X1, X2, …, Xn consisting of 1 × k vectors, define
where![]()
Actually, we use the sample versions of skew and kurt. We obtain these by multiplying skew as described above by (n/(n-1))^3 and kurt by (n/(n-1))^2.
Skewness Test
Mardia’s Skewness Test: If the sample comes from a multivariate normal distribution (null hypothesis), then
For small samples (generally fewer than 20 sample elements), we have the following corrected statistic
and df is as above.
Caution: Actually, some sources list the denominator of c as n((n+1)(k+1) – 6).
Kurtosis Test
Mardia’s Kurtosis Test: If the sample comes from a multivariate normal distribution (null hypothesis), then

Worksheet Functions
Real Statistics Functions: The Real Statistics Resource Pack provides the following array functions.
MSKEWTEST(R1, lab, correct1): Mardia’s skewness test for multivariate normality; returns a column range with the values skewness, chi-square statistic, df and p-value, plus corrected statistic and p-value for small samples
MKURTTEST(R1, lab): Mardia’s kurtosis test for multivariate normality; returns a column range with the values kurtosis, z-statistic and p-value
If lab = TRUE then an extra column of labels is appended to the results (defaults to FALSE).
If correct1 = TRUE (default), then the current approach for Mardia’s skewness test for small samples is used. Otherwise, the revised approach as specified in the Caution statement is used.
Example
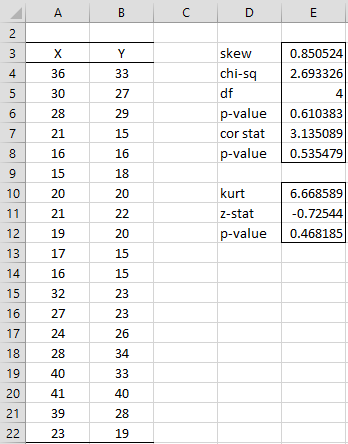
Example 1: Determine whether the data in Example 1 of Multivariate Normality Functions (repeated in range A3:B22 of Figure 1) is bivariate normally distributed using Mardia’s Test.
We use MSKEWTEST(A4:B22,TRUE) and MKURTTEST(A4:B22, TRUE) as shown in Figure 1. We see that p-value = .610 (or p-value = .535 using the correction factor for small samples) for the skewness test and p-value = .468 for the kurtosis test. Since all these p-values are larger than alpha = .05, we retain the null hypothesis and consider the sample as coming from a normal distribution.

Figure 1 – Mardia’s Test
Manual Calculations
We can carry out the calculations of the Mardia test for Example 1 in Excel, without using the Real Statistics MSKEWTEST and MKURTTEST functions, with a little extra effort, as shown in Figures 2, 3, and 4.

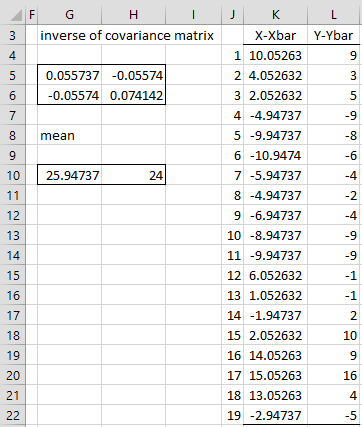
Figure 2 – Mardia Test (part 1)
In Figure 2, we calculate S-1 (range G5:H6) using the worksheet array formula =MINVERSE(COV(A4:B22)) and the mean vector (range G10:H10) by using the formulas =AVERAGE(A4:A22) and =AVERAGE(B4:B22). We next subtract the mean vector from each of the data vectors (range K4:L22) by placing the formula =A4-G$10 in cell K4, highlighting the range K4:L22 and pressing Ctrl-R and Ctrl-D.
Calculating mij values
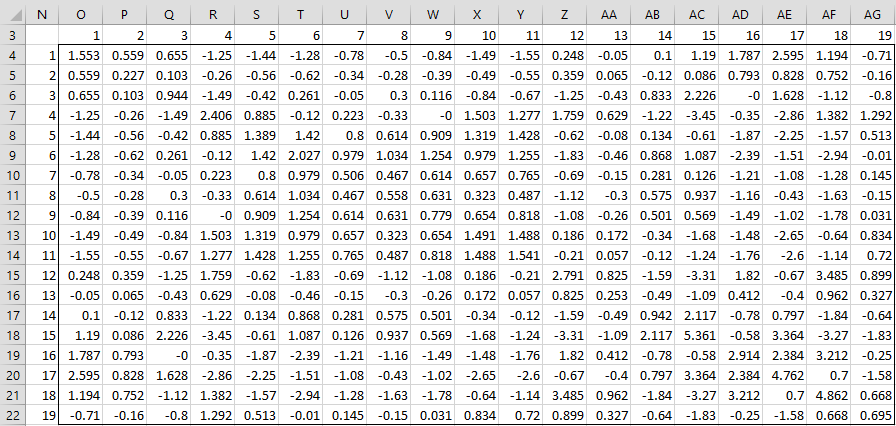
In Figure 3, we calculate the mij values. We do this by placing the following array formula in cell O4
=MMULT(MMULT(INDEX($K$4:$L$22,$N4,),$G$5:$H$6),TRANSPOSE(INDEX($K$4:$L$22,O$3,)))
and then highlighting the range O4:AG22 and pressing Ctrl-R and Ctrl-D. E.g. cell AC12 contains the value of m9,15.

Figure 3 – Mardia Test (part 2)
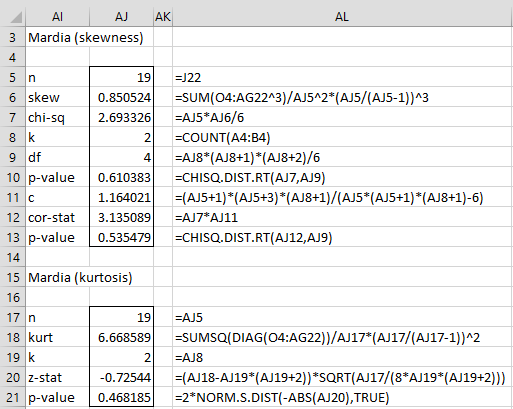
We finally calculate the test statistics and p-values as shown in Figure 4.

Figure 4 – Mardia Test (part 3)
Alternative Test
The Friedman-Rafsky-Smith-Jain test is an alternative way to test for multivariate normality.
Examples Workbook
Click here to download the Excel workbook with the examples described on this webpage.
References
Korkmaz, S., Goksuluk, D. and Zararsiz, G. (2014) MVN: An R Package for Assessing Multivariate Normality. The R Journal Vol. 6/2.
https://pdfs.semanticscholar.org/5f56/fddab96311b6ff592fe1f1f59093809900a3.pdf?_gl=1*q3i27e*_gcl_au*ODAxMTg0NjM3LjE3NjM2NTc3Njk.*_ga*MjA0NDg0NjQ1NS4xNzYzNjU3NzY5*_ga_H7P4ZT52H5*czE3NjQ3NTEyMDIkbzIkZzAkdDE3NjQ3NTEyMDIkajYwJGwwJGgw
Mardia, K. V. (1970) Measures of multivariate skewness and kurtosis with applications. Biometrika, 57, 519–530.
https://www.jstor.org/stable/2334770


Hi Charles, thank you for this article.
Could you please explaine me formula for calculating kurtosis p-value: 2*NORM.S.DIST(-ABS(AJ20),TRUE) ? I don’t understand why it is multiplied by 2 and why you accept the value -ABS.
Sorry if this is a stupid question, I’m new to statistics.
Hi Artem,
Not a stupid question.
E.g. NORM.S.DIST(2,TRUE) = .97725 and NORM.S.DIST(-2,TRUE) = 1-.97725 = .02275.
In general, the one-tailed p-value = NORM.S.DIST(-x,TRUE) for x > 0. Thus, p-value = NORM.S.DIST(-ABS(x),TRUE).
The two-tailed p-value is the double of this value, namely 2*NORM.S.DIST(-ABS(x),TRUE).
Charles
Thank you very much. Your article and explanation are just great, you have helped me a lot.
Hi Charles,
I am working on some data that I need to show is multivariate normal, and I was excited to find your examples and explanations, as they have helped me verify that my approach is working. However, I keep finding one discrepancy, and I believe I have traced it back to your calculation of the S^-1 matrix. When you show the “inverse of covariance matrix” (G5:H6 of figure 2), you use “=MINVERSE(COV(A4:B22))” and the result is [0.055737, -0.05574; -0.05574, 0.074142]. But when I calculate S^-1 in Matlab (using “Sinv = ((x(:,1:n)-Xbar)*(x(:,1:n)-Xbar)’/n)^-1;”), I get [0.0588, -0.0588; -0.0588, 0.0783]. I am able to obtain the same results in excel by manually calculating each entry of S (by using COVARIANCE.P) and then using MINVERSE.
I believe that when you use COV to calculate S, the COV function is using the sample covariance rather than the population covariance. I was able to confirm this by using COVARIANCE.S and MINVERSE, and obtaining the same results you have in figure 2.
Could you please help me to understand if I should be using the population covariance to calculate S (as shown in the equation) or the sample covariance (as shown in figure 2)?
Thank you very much,
Michael
Hi Michael,
COV definitely calculates the sample covariance matrix. COVP calculates the population covariance matrix.
I assumed that the sample version was used in the test, but I have not read Mardia’s original paper.
Charles
Dear Charles,
Is it possible to receive one p-value larger than alpha and the second one smaller than alpha? For example, p-value for skew>alpha and p-value for kurt<alpha. And if it is, what the conclusion should be? Thanks.
Justine,
Yes, this is possible.
For normality, you want both skewness and kurtosis to be consistent with a normal distribution; i.e. to show normality, you want the tests for both skewness and kurtosis to not be significant.
The d’Agostino-Pearson test actually combines both tests into one, accepting normality even if skewness is a little off provided kurtosis compensates for it (or vice versa with the roles of skewness and kurtosis reversed). See
d’Agostino-Pearson test
Charles
The skewness manual calculation uses a correction factor of (n/(n-1))**3 which does not appear on the equation. Can you please comment on this?
Hello Oscar,
I don’t know what you are referring to. Can you explain this further or give me a reference?
Charles
Hi Charles,
The calculation in row 6 column AL in Fig. 6 above uses (AJ5/(Aj5-1))^3. Where that does come from?
Hello Oscar,
This is explained on the webpage in the following paragraph:
“Actually, we will use the sample versions of skew and kurt, which are obtained by multiplying skew as described above by (n/(n-1))^3 and kurt by (n/(n-1))^2.”
Charles
Everything beautifully explained, however, I noticed one mistake in the correction formula c. In denominator there should be additional brackets.
Instead of:
n (n + 1) (k + 1) -6
should be:
n {(n + 1) (k + 1)} -6
When we correct the pattern, we get the correct result.
Barbara
Hello Barbara,
Perhaps I am missing something, but the two expressions are equivalent (associative rule of multiplication).
Charles
Charles, The original paper by Mardia, 1974 “Applications of Some Measures…” shows the denominator n{(n+1)(k+1)-6} which is different from your proposal. Can you comment?
Hello Kirill,
I haven’t been able to access the 1974 paper.
I believe that the version that I have used is written in various papers, including this one:
https://cxd.github.io/scala-au.id.cxd.math/notes/mvn_testing.html
Charles
Kirill,
Can you email me a copy of the paper or even just the page with the formula in question?
Charles
Hello Kirill,
I have now seen this both ways. Take a look at
R : https://digitalcommons.unl.edu/cgi/viewcontent.cgi?article=1439&context=r-journal
SAS : https://documentation.sas.com/doc/th/pgmsascdc/v_051/etsug/etsug_model_sect120.htm
Charles
P.S. I’ve tried simulations on small sample size (15 cases, 5 variables), and the Q-Q plot showed much more handsome result with the original denominator than with “yours”.
I want to calculate mardia skew and kurt test manually and by formula, not by real statistics functio.
Can you calculate example manually in Excel?
Hello Arash,
I have now added this to the webpage. Thanks for your suggestion.
Charles
WHERE?
I don’t know what you are referring to.
Charles
Dear Charles
I have two independent variables, two intermediate variables and one dependent variable.
I entered data of these variables in A1:E360. I want to use Mardia to test multivariate normality.
Do I have to run the following formula?
MSKEWTEST(A1:E360,TRUE) and MKURTTEST(A1:E360, TRUE).
These formulas will conduct Mardia’s test for the data consisting of 360 5-tuples. This may or may not be the multivariate normality test that you need.
Charles
thanks Mr.
I have one question more. are i and j indicates the index for the observations?
Yes
Excuse me, I want to ask some questions. If I have 2 variable that I want to know the multivariate normality and in each variable I have 38 observations, so in this case what i , j, n, k ? Thanks.
Ayu,
As described on the webpage, n = the number of sample k-tuples and k = the number of variables. In your case n = 38 and k = 2. i and j are indices that go from 1 to n in the summation.
What probably made this confusing is that the formula given for m_ij is incorrect. The revised version is now on the webpage.
Thanks for your comment. Thanks to you, I found the typo and improved the quality and accuracy of the website.
Charles
Thanks Mr.
Yeah the formula m_ij makes me confused. are both ‘i’ and ‘j’ declare index of the observations or what ? so, how about m_ii ? please help me overcome my confusions
Ayu,
Suppose m_ij = i*j for 1<=i,j<=3. I will use Sigma to represent the summation symbol. Then Sigma for i = 1 to 3 of m_ii is m_11 + m_22 + m_33 = (1*1) +(2*2) + (3*3) = 1+4+9 = 14. Sigma for i = 1 to 3 of Sigma j = 1 to 3 og m_ij is equal to Sigma for i = 1 to 3 of m_i1 + m_i2 + m_i3, which is equal to Sigma for i = 1 to 3 of i+2i+3i = Sigma for i = 1 to 3 of 6i = 6 + 12 + 18 = 36. Charles
Dear Charles,
I was using the information on the array formulas and I still have the same issue as Lidya. I am using Excel 2013. Please advise. Thanks.
Alina,
The referenced functions are what are called array functions in Excel, and so you can’t simply press Enter to get the results. Using such functions is pretty easy though. See the follow webpage for details:
Array Formulas and Functions
Charles
Dear Charles,
I have installed the 2013 Excel version of the Real Statistics Resource package and am trying to perform multivariate normality tests—specifically Mardia’s skewness and kurtosis tests. I can’t find the tests under the Real Statistics Data Analysis Tools (e.g. it’s not under the “Multivariate” menu), nor can I find the functions listed within my Functions library. But I can call up the two functions (MSKEWTEST and MKURTTEST). However, when lab = TRUE, the output is solely the word “skew” or “kurt”; when lab = FALSE, the output is a single skewness or kurtosis value. However, I would like to determine the p-values, p-values corrected for small sample size, etc, and these do not appear when lab = TRUE. Is there something that I am doing incorrectly? Thanks!
Lidya,
Currently the Real Statistics data analysis tools don’t support these tests, but as you have observed you can use the MSKEWTEST and MKURTTEST functions.
These are what Excel calls array functions and so you can’t simply press the Enter key when you use them. The approach with array functions is different but pretty simple. See the following webpage for details:
Array Formulas and Functions
Charles