When cost constraints permit, multiple replications can improve the quality of a Taguchi design. When replications are available, the df and SS values in the ANOVA need to be modified from that described in Figure 4 of 2-level Taguchi Design.
Example
Example 1: Repeat Example 1 of 2-level Taguchi Design using the replicated noise measurements shown in Figure 1.
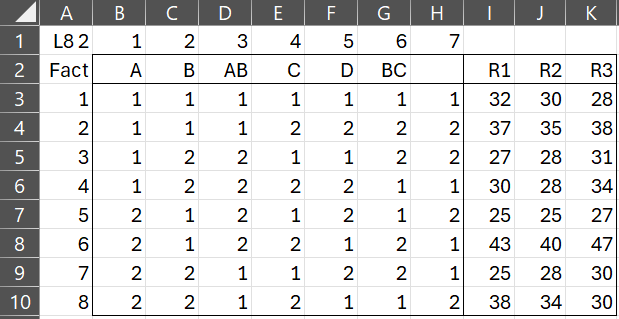
Figure 1 – Design with replications
This is the same design as shown in Figure 2 of 2-level Taguchi Design except that two additional results columns have been added. We can again use the Taguchi DOE data analysis tool. The only modification is that we need to insert the range A1:K10 into the Input Range field in the dialog box in Figure 1 of Taguchi DOE data analysis tool.
After clicking on the OK button, we obtain the results shown in Figures 2, 3, and 4.
Output from data analysis tool
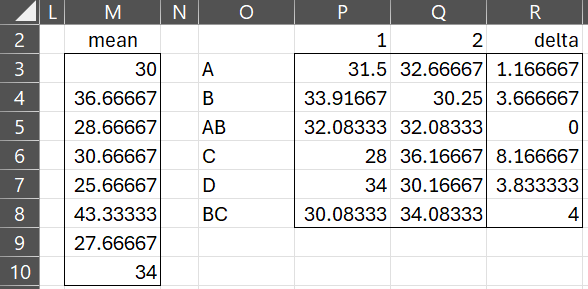
Figure 2 – Analysis with replications (part 1)
Here, the mean of the 3 replications for each of the 8 trials is shown in column M of Figure 2. E.g. cell M3 contains the formula =AVERAGE(I3:K3). The other columns in the figure are calculated as for the case without replications using the column M instead of column I.
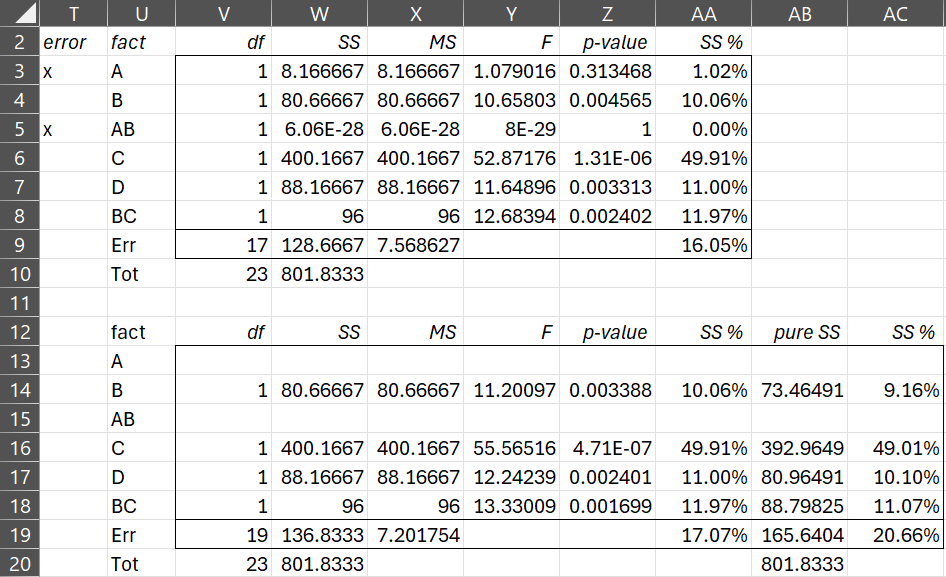
Figure 3 – Analysis with replications (part 2)
ANOVA
The ANOVA analysis as in Example 1 using the table on the right side of Figure 2, but with modifications to the dfTot and SS values. Instead of setting the dfTot (cells V10 and V20) to the number of trials minus 1, we set it to the number of results minus 1, namely 23 using the formula =COUNT(I3:K10)-1. The df values for each factor does not change, but the dfErr term changes since the dfTot has increased.
Caution: There is a bug in the output from the Taguchi DOE data analysis tool for the df for each factor. Instead of 1 the value 5 is displayed, calculated as 2*3-1. You need to manually remove the 3 from the formula that calculates each df in column V of Figure 3.
Similarly, the SSTot value is now calculated by the formula =DEVSQ(I3:K10. The formulas for SS for each of the factors is multiplied by the number of replications. E.g. the formula for SSA in cell W3 is =DEVSQ(P3:Q3)*4*3 where 4 = the number of times 1 (or 2) is repeated in each column in Figure 1 and 3 is the number of replications, i.e.
=DEVSQ(P3:Q3)*COUNTIF(INDEX($B$3:$H$10,,MATCH(U3,$B$2:$H$2,0)),1)*COUNT(I3:K3)
Finally, SSErr (in cell W9) is calculated, as before, via the formula =W10-SUM(W3:W9).
Combinations
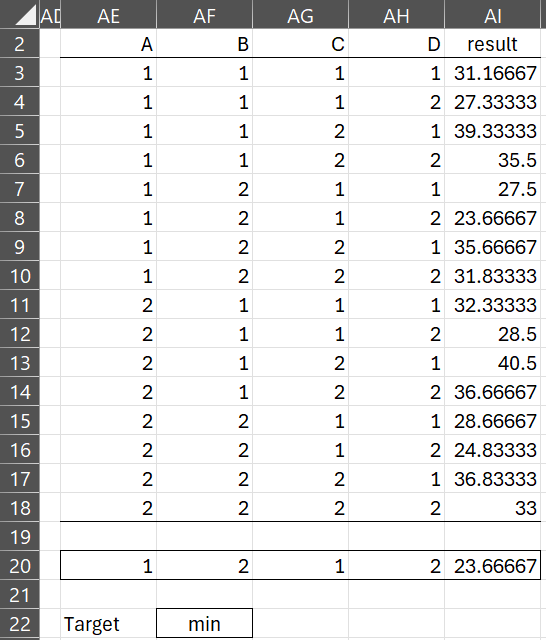
Figure 4 – Analysis with replications (part 3)
The results shown in Figure 4 are calculated from the data on the right side of Figure 2 in the same way as in the case without replications.
Examples Workbook
Click here to download the Excel workbook with the examples described on this webpage.
References
Roy, R. K. (2010) A primer on Taguchi method. 2nd ed. Society of Manufacturing Engineers
https://www.scribd.com/document/381615601/288020391-a-Primer-on-the-Taguchi-Method
University of York (2004) Orthogonal arrays (Taguchi designs)
No longer available online
Minitab (2024) Catalogue of Taguchi designs
https://support.minitab.com/en-us/minitab/help-and-how-to/statistical-modeling/doe/supporting-topics/taguchi-designs/catalogue-of-taguchi-designs/