As we can see from cell O13 of Figure 5 of Randomized Complete Block Design, there is a significant difference in crop yield between the various dosages of herbicide for Example 1 of Randomized Complete Block Design. We can now perform a number of follow-up tests as described in Planned Follow-up Tests and Unplanned Follow-up Tests. In particular, the Real Statistics Resource Pack supports Contrasts and Tukey’s HSD.
Contrasts
Example 1: Use Contrasts to determine whether there is a significant difference in yield between 10 units of herbicide and (the average of) the other dosages for Example 1 of Randomized Complete Block Design.
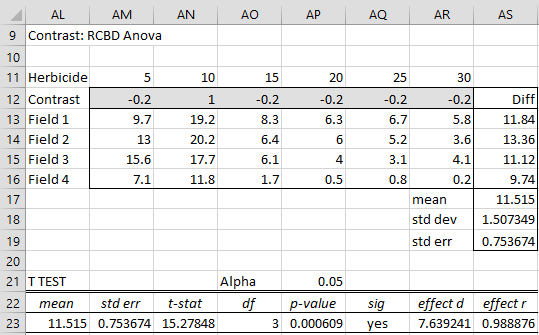
We can use the RCBD data analysis tool, as described in Randomized Complete Block Design, this time checking the Contrasts option of Figure 4 of Randomized Complete Block Design. Since we only need to perform one contrast we retain the default number of contrasts of 1 in the Alpha correction for contrasts. The output is shown in Figure 1, where initially range AM12:AR12 is empty.
Figure 1 – Contrasts for RCBD
We now fill in range AM12:AR12 with the contrast coefficient values shown in Figure 1. We see from cell AQ23 that there is a significant difference between the yield using a 10 unit dosage and the average of the other dosages.
If we had wanted to perform multiple contrasts in order to control familywise error, we would choose the Bonferroni or Dunn/Sidak option in the Alpha correction for contrasts portion of the dialog box and change the number of contrasts from the default of 1 to the number of contrasts we planned to perform.
Observation: To get more information about how the various cells in Figure 1 are calculated, see Figure 4 of Repeated Measures Anova since the calculations are similar to those for contrasts for ANOVA with Repeated Measures.
Tukey’s HSD
Example 2: Use Tukey’s HSD to determine which dosages from Example 1 are significantly different.
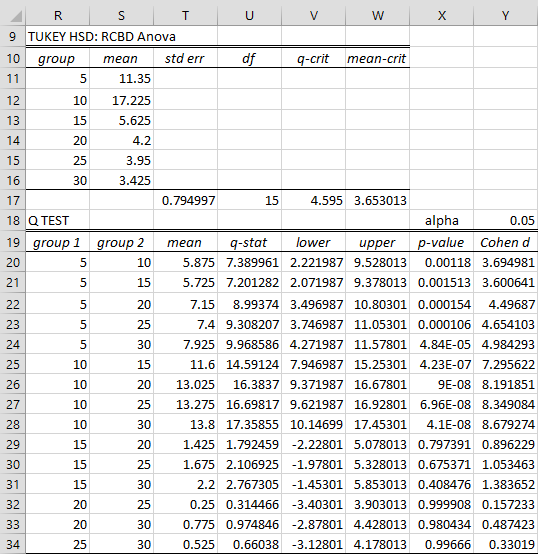
We can again use the RCBD data analysis tool, as described in Randomized Complete Block Design, this time checking the Tukey HSD option in Figure 4 of Randomized Complete Block Design. We start by filling in the contrast coefficients in range AB11:AB16 as shown in Figure 2.
Figure 2 – Tukey’s HSD for RCBD
We see that p-value = .00118 < .05 = α, which means that there is a significant difference in yield between 5 units and 10 units. Thus, we can conclude that there is a significant difference between 5 units and any of the other dosages. Similarly, we see there is a significant different difference between 10 units and 15 units, and therefore between 10 units and any of the other dosages. We can also see that there is not a significant difference between any of the pairs of dosages among 15, 20, 25 and 30 units.
See Figure 3 for how some representative cells in Figure 2 are calculated (with reference to cells in Figure 1 and 5 of Randomized Complete Block Design).
| Cell | Entity | Formula |
| S11 | mean for group 5 | =AVERAGE(B4:B7) |
| T17 | standard error | =SQRT(M15/COUNT(B4:B7)) |
| U17 | df | =L15 |
| V17 | q-crit | =QCRIT(COUNT(S11:S16),U17,Y18,2) |
| W17 | mean-crit | =T17*V17 |
| T20 | mean diff groups 5 and 10 | =ABS(S11-S12) |
| U20 | q-stat | =T20/T$17 |
| V20 | lower conf interval | =T20-W$17 |
| W20 | upper conf interval | =T20+W$17 |
| X20 | p-value | =QDIST(U20,COUNT(S$11:S$16),U$17) |
| Y20 | effect size d | =U20/SQRT(COUNT(B$4:B$7)) |
Figure 3 – Representative formulas from Figure 2
Modified Tukey’s HSD
Example 3: Use the modified version of Tukey’s HSD to determine which dosages from Example 1 are significantly different. This means that instead of using the ANOVA MSE value to compute the standard errors (as in cell T17), we calculate the standard errors directly based on the data for each comparison.
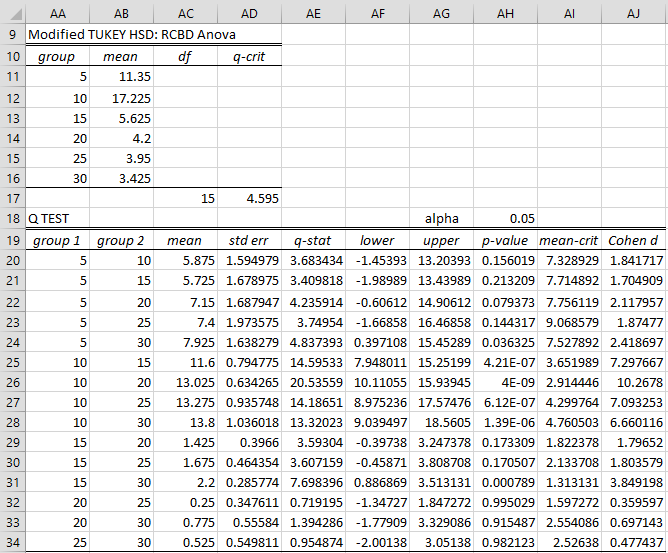
Once again, we use the RCBD data analysis tool, as described for Example, this time checking the Modified Tukey HSD option of Figure 4 of Randomized Complete Block Design. The result is shown in Figure 4.
Figure 4 – Modified Tukey’s HSD for RCBD
This time, we see that the only significant comparisons are between 10 units and any of the other dosages, as well as between 15 and 30 units.
The formulas used are similar to those in Figure 3, with the principal difference the formula used to calculate the standard errors. E.g. the array formula in cell AD20 is =STDERR(MSUB(B4:B7,C4:C7)). Here we use the MSUB function to subtract the elements in column B from the corresponding element in column C, ignoring any pair where one or both of the elements are non.numeric. This is important when there are missing data elements (as described in RCBD with One Missing Data Element and RCBD using Regression). Also, the dfE value in cell AC17 is calculated using the formula =dfWF(B12:G15,1).
Examples Workbook
Click here to download the Excel workbook with the examples described on this webpage.
References
Montgomery, D. C. (2012) Design and analysis of experiments. 8th ed. Wiley
https://faculty.ksu.edu.sa/sites/default/files/douglas_c._montgomery-design_and_analysis_of_experiments-wiley_2012_edition_8.pdf
Hale, I. (2016) Randomized Complete Block Designs (RCBDs)
https://www.unh.edu/halelab/ANFS933/Lectures/Lect8.pdf


Rcbd with 9 treatments and 3 replications
Provide me analysis excel file
See https://real-statistics.com/design-of-experiments/completely-randomized-design/randomized-complete-block-design/
Charles
Charles,
In the version I have (6.0.4 Excel 2010/2013/2016/2019/365 Windows), it does not have the option to enter the number of contrast (ie, Anova Correction for Contrast as you stated in the text). If I want to test multiple contrasts, I could use what we have in the version and just control the familywise experimental error. Is this correct?
Thanks,
-Sun
Sun,
Yes, that is correct.
Charles
Sir, PlZ help me for RCBD 5 treatments and 4 replication
See https://real-statistics.com/design-of-experiments/completely-randomized-design/randomized-complete-block-design/
Charles
Plz help me RCBD for 6 treatment and 5 block
Hani,
See https://real-statistics.com/design-of-experiments/completely-randomized-design/randomized-complete-block-design/
Charles
sir can i used FCRD for 5 treatments with 4 replications
Kalpana,
You can use RCBD for 5 treatments and 4 replications.
Charles