Basic Concepts
In Kendall’s Tau Testing we explore how to perform testing as to whether Kendall’s correlation is statistically different from zero. On this webpage, we show how to test whether Kendall’s correlation τ is statistically different from τ0 for any value of τ0, even where τ0 is not zero.
We again use the Fisher transformation, as described in Correlation Testing via Fisher Transformation, for hypothesis testing. In particular, to test the null hypothesis that τ = τ0, we can use the test
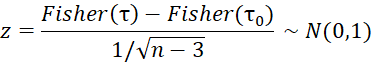
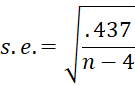
where τ is Kendall’s’s tau for your data. If the sample size n ≥ 10 and |τ| ≤ .8, then the standard error in the denominator of the test can be replaced by
We can use a similar approach to that described in Spearman’s Hypothesis Testing to create a confidence interval for Kendall’s tau using a Fisher transformation. This confidence interval may be different from the one described in Kendall’s Correlation Testing.
Example
Example 1: Test whether Kendall’s tau is significantly different from -.1 based on the data in Example 1 of Kendall’s Tau Testing (repeated in Figure 1).
We see from Figure 1 that there is a significant difference between the population Kendall’s tau and -.1.
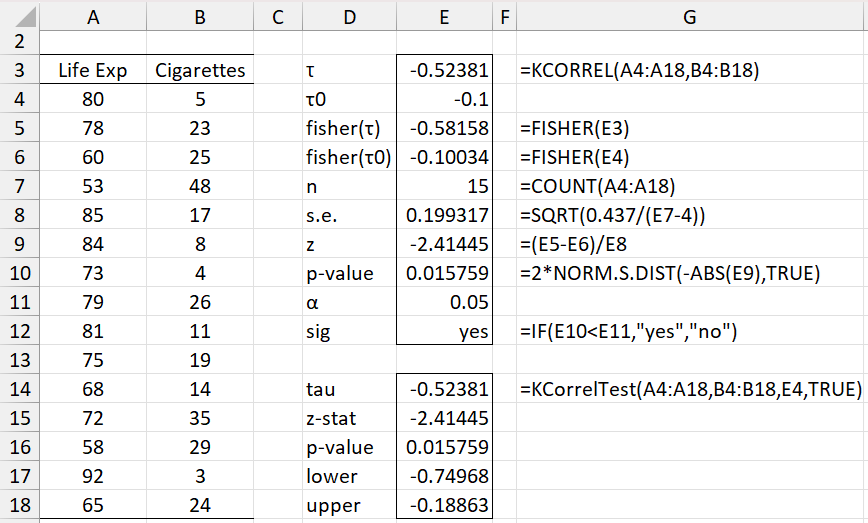
Figure 1 – Hypothesis testing using Fisher’s transformation
Example 2: Calculate a 95% confidence for the data in Example 1 using a Fisher transformation.
We obtain the confidence interval (-.74968, -.18863) as shown in Figure 2.
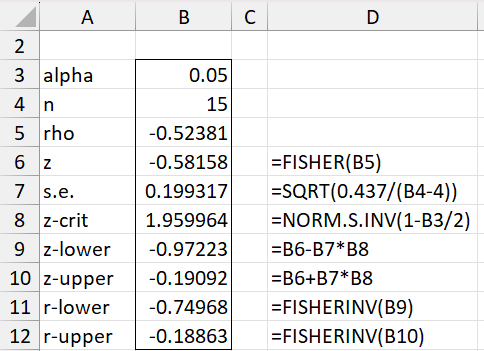
Figure 2 – Confidence interval for Kendall’s tau
Note that -.1 is not in this interval, confirming the result obtained for Example 1.
Worksheet Function
The Real Statistics Resource Pack provides the following worksheet function:
KCorrelTest(R1, R2, tau lab, tails, alpha, ties): an array function which outputs a column array consisting of the sample Kendall’s tau, the z-stat (based on a Fisher transformation) and p-value which test the null hypothesis that τ = tau and the lower/upper ends of a 1–alpha confidence interval (as described above).
If lab = TRUE then a column of labels are added to the output (default is FALSE). tails = 1 or 2 (default) and alpha = significance level (default .05). R1 and R2 must have the same shape and size. If ties = TRUE (default) then the ties correction is used when calculating Kendall’s tau.
We can use the KCorrelTest function to obtain the results for Example 1 as shown in range D14:E18 of Figure 1.
Examples Workbook
Click here to download the Excel workbook with the examples described on this webpage.
References
NCSS (2024) Correlation
https://www.ncss.com/wp-content/themes/ncss/pdf/Procedures/NCSS/Correlation.pdf
Bonett, D. G. and Wright, T. A. (2000) Sample size requirements for estimating Pearson, Kendall and Spearman correlations. Psychometrika 65, no. 1: 23–28.
https://www.researchgate.net/publication/24063325_Sample_size_requirements_for_estimating_Pearson_Kendall_and_Spearman_correlations
Bishara, A. J., Hittner, J. B. (2007) Confidence intervals for correlations when data are not normal. Behavior Research Methods 49, no. 1: 294–309. https://doi.org/10.3758/s13428-016-0702-8
Fieller, E. C., Hartley, H. O., Pearson, E. S. (1957) Tests for rank correlation coefficients. Biometrika, Vol. 44, No. 3/4, pp. 470-481.
https://scispace.com/pdf/tests-for-rank-correlation-coefficients-i-o7sh3ewtfj.pdf