Overview
We describe the testing of 2 × 2 contingency tables for independence, including the chi-square test and Fisher and Boschloo exact tests. We also describe the 2 × 2 Contingency Table Testing data analysis tool.
A 2 × 2 contingency table takes the following form
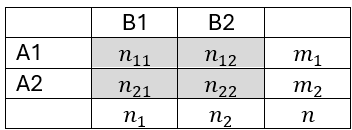
Chi-square Test
The expected values mij in the usual chi-square test is
mij = mi ⋅ nj / n
and the Pearson’s chi-square test statistic is
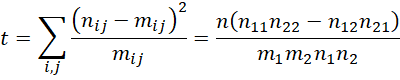
The version that includes a Yates’ correction is
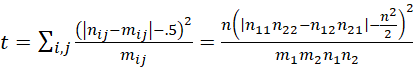
The maximum likelihood statistic is
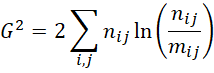
where for this test, we assume that ln 0 = 0.
For either version p-value = CHISQ.DIST.RT(t, df) where df = 1.
Click here for details.
Fisher’s exact test
The one-sided Fisher’s exact test uses a sum of expressions of the following form
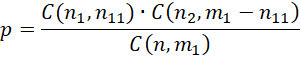
Click here for details.
Equality of proportions
In the case where the row totals are fixed, we can test the equality of proportions via the pooled (standard normal) statistic
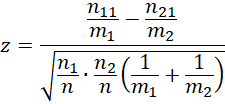
Note that z2 = t where t is Pearson’s chi-square test statistic.
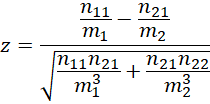
The unpooled version of this test uses the following test statistic, although we don’t usually use this approach.
Boschloo exact test
When the row totals are fixed, we can test independence using Boschloo’s exact test. This test uses both the Fisher exact test and the binomial test.
Click here for details.
Data Analysis Tool
The Real Statistics Resource Pack will provide the 2 × 2 Contingency Table Testing data analysis tool.
This tool outputs the Fisher and Boschloo exact tests for 2 × 2 contingency tables as well as information about the odds ratio.
To use this tool for Example 1 of Boschloo Exact Test, press Ctrl-m, and select the 2 × 2 Contingency Table Testing option from the Misc tab. Next, fill in the dialog box that appears as shown in Figure 1.
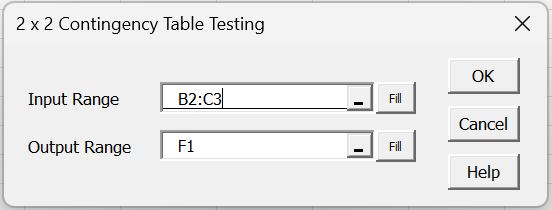
Figure 1 – Dialog Box
The left side of Figure 2 displays the 2 × 2 contingency table. After clicking on the OK button, the output on the right side of Figure 2 appears.
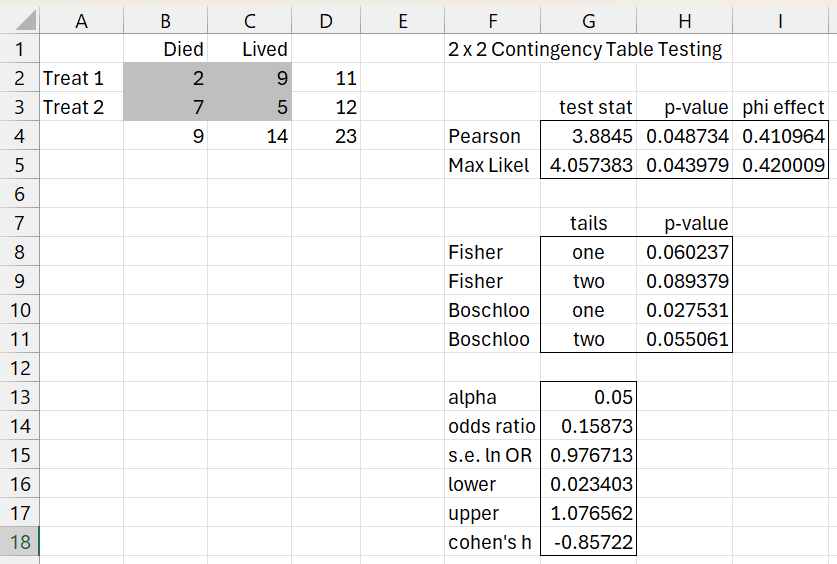
Figure 2 – Data analysis tool output
The various formulas used in Figure 2 are shown in Figure 3.
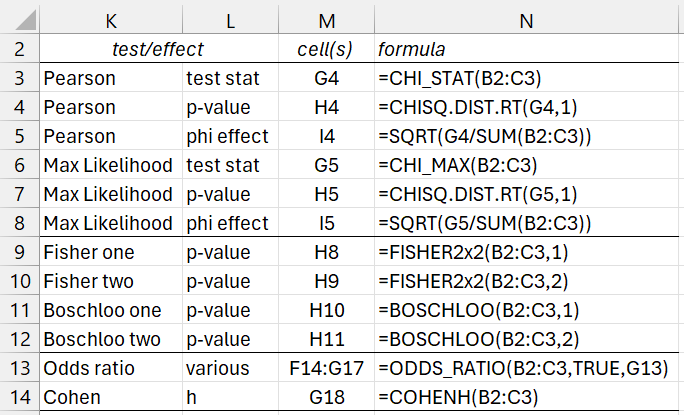
Figure 3 – Formula descriptions
If you change any value in B2:C3 or G13, the other values in Figure 2 will change automatically. Click here for a description of the ODDS_RATIO function. An odds ratio of 1 indicates no association (i.e. independence). Since the 95% confidence for the odds ratio is (.023, 1.0779) and 1 is contained in this interval, we have evidence in favor of the hypothesis that the events are independent.
Worksheet Function
The Real Statistics Resource Pack provides the following function
COHENH(R1) = Cohen’s h effect size for the 2 × 2 contingency table in R1.
Cohen’s h is defined as
=2*(ASIN(SQRT(n11/m1))-ASIN(SQRT(n21/m2)))
See also Cohen’s h Effect Size, for more details. In particular, .2, .5, and .8 represent small, medium, and large effects, respectively.
For Example 1, Cohen’s h effect size (shown in cell G18) is large.
Examples Workbook
Click here to download the Excel workbook with the examples described on this webpage.
Links
↑ Chi-square and F distributions
References
Vanhove, J. (2024) Exact significance tests for 2 × 2 tables
https://janhove.github.io/posts/2024-09-10-contingency-p-value/
Lydersen, S., Fagerland, M. W., Laake, P. (2009) Recommended tests for association in 2×2 tables
https://pubmed.ncbi.nlm.nih.gov/19170020/
Rdocumentation (2026) exact.test: Unconditional exact tests for 2×2 tables with independent samples
https://www.rdocumentation.org/packages/Exact/versions/3.3/topics/exact.test