Objective
We describe how to perform the Bayesian versions of the McNemar, Sign, and Median tests in Excel. Since these tests are binary in nature, the Bayesian versions are based on a beta prior and beta posterior.
Bayesian McNemar’s Test
This test is often used to determine whether there is a significant change in nominal data before and after an event. Actually, it can used for any paired sample study with dichotomous data.
Example 1: We repeat Example 1 from McNemar’s Test using a Bayesian approach.
In this example
A = number of people who switched from in favor to against = 6
B = number of people who switched from against to in favor = 11
We look at the population response-switching rate φ. A value φ > .5 is considered an improvement. We use this as the alternative hypothesis and assume a uniform beta prior.
The posterior beta distribution has parameters a = 11+1 = 12 and b = 6+1 = 7. The result of the analysis is shown in Figure 1 using the array formula =BayesBeta(12,7,TRUE).
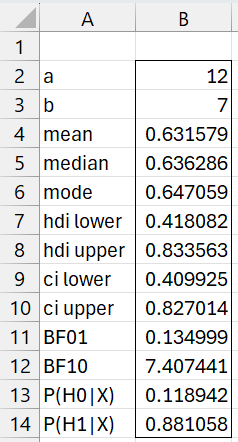
Figure 1 – Bayesian McNemar’s Test
BF10 = 7.4 shows limited support for the alternative hypothesis that there is a difference between these changes in opinion.
Bayesian Sign Test
As we know, the sign test is really a proportion test in disguise, and so it is not surprising that once again we use a beta test.
Example 2: Test the hypothesis that the percentage of sample pairs whose difference is positive is larger than 50% based on the data on the left of Figure 2.
We count the number of pairs for which the element is Grp 2 is larger than the corresponding element in Grp 1. This is done by placing the array formula =SUM(IF(A2:A13<B2:B13,1,0)) in cell E2. Similarly, we place the formula =SUM(IF(A2:A13>B2:B13,1,0)) in cell E3. We ignore any equal pairs.
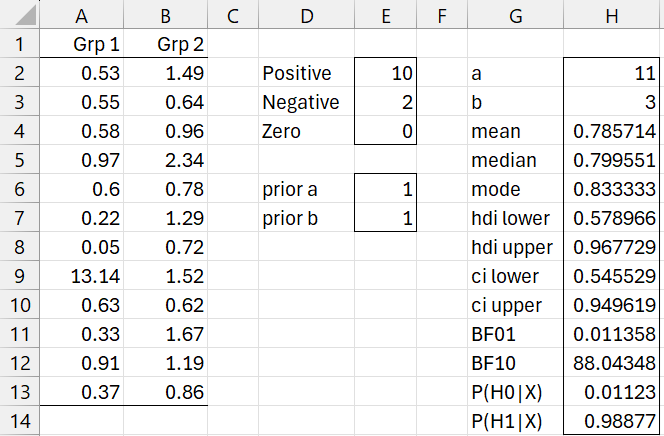
Figure 2 – Bayesian Sign Test
Using a uniform prior, we obtain the results of the analysis via the formula
=BayesBeta(E2+E6,E3+E7,TRUE).
We see there is solid support for the alternative hypothesis that φ > .5, with BF10 = 88.
Worksheet Function
The Real Statistics Resource Pack provides the following worksheet function:
BayesSign(R1, R2, lab, a, b, alpha): return an array with the same values as in BayesBeta for a sign test based on the paired data in R1 and R2, and a beta prior with parameters a and b (both defaulting to 1).
Credible intervals are based on alpha (default .05). If lab = TRUE (default FALSE), a column of labels is appended to the output.
We can obtain the same results shown in range G2:H14 of Figure 2 by using the formula
=BayesSign(A2:A13,B2:B13,TRUE,E6,E7).
Bayesian Median Test
The Bayesian version of the median test is to see whether the population version φ of the proportion of the above median responses from sample 1 is higher than the expected proportion, namely n1/(n1+n2) where n1 is the size of sample 1 and n2 is the size of sample 2. Thus, the hypotheses are:
H0: φ <= n1/(n1+n2)
H1: φ > n1/(n1+n2)
Since the outcomes are binary, we use beta priors and posteriors, as shown in Example 3.
Example
Example 3: Perform the Bayesian median test based on the samples in columns A and B of Figure 3.
First, we calculate the sizes of the two samples, as shown in cells E2 and E3. The test statistic is therefore n1/(n1+n2) = 20/(20+10) = 2/3, as shown in cell E4. Next, we calculate the combined median using the formula =MEDIAN(A2:B21), obtaining the result shown in cell E5.
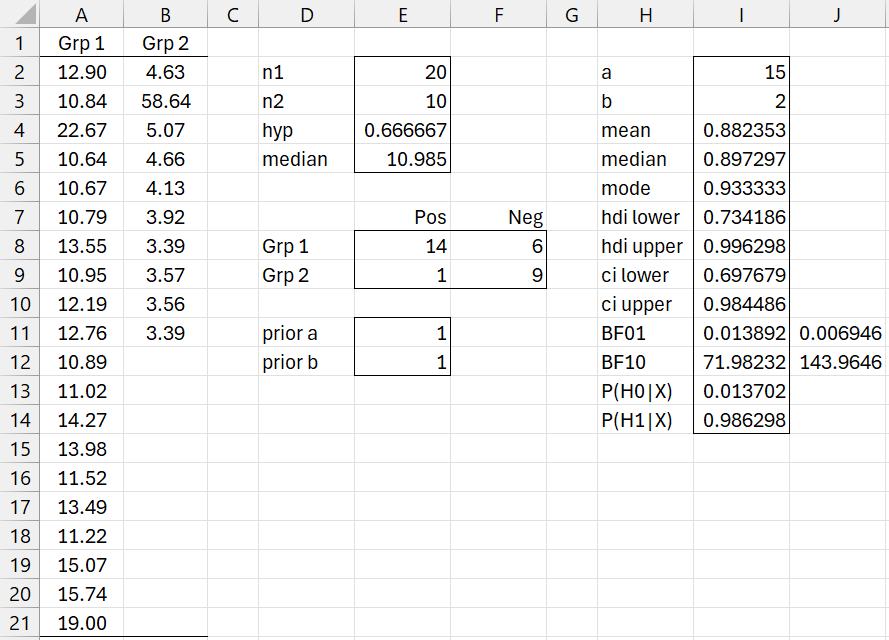
Figure 3 – Bayesian Median Test
We now calculate the number of entries in each sample that are greater than the combined median. Using the formula =COUNTIF(A2:A21,”>”&E5), we see in cell E8 that 14 of the 20 entries for sample 1 are greater than the median. Similarly, the formula =COUNTIF(B2:AB1,”>”&E5) in cell E8 shows that only 1 of the 10 entries for sample 2 are greater than the median.
We now use, the formula =BayesBeta(E8+E11,E9+E12,TRUE,,E4) to display the preliminary analysis, based on a uniform prior. This formula assumes a priori that the initial probabilities are the same, but since sample 1 starts with twice as many elements as sample 2, we need to double the value of BF10 and halve the value of BF01, with the change shown in cells J11 and J12.
Worksheet Function
The Real Statistics Resource Pack provides the following worksheet function:
BayesMedian(R1, R2, lab, a, b, alpha): return an array with the same values as in BayesBeta for a Median test based on the independent data in R1 and R2, and a beta prior with parameters a and b (both defaulting to 1).
Credible intervals are based on alpha (default .05). If lab = TRUE (default FALSE), a column of labels is appended to the output.
We obtain the same result for Example 3 using the formula BayesMedian(A2:A21, B2:B11, TRUE, E11, E12).
Examples Workbook
Click here to download the Excel workbook with the examples described on this webpage.
References
Chechile, R. A., Barch, D. H. Jr. (2025) Distribution-free Bayesian analyses with the DFBA statistical package
https://link.springer.com/article/10.3758/s13428-025-02605-6